How Popular is Matplotlib?#
Data |
Local |
Coiled |
Speed Up |
Cost |
|---|---|---|---|---|
1 TB of PDFs |
3600 mins |
10 mins |
360x |
$0.90 |

Anecdotally the Matplotlib maintainers were told
“About 15% of arXiv papers use Matplotlib”
arXiv is the preeminent repository for scholarly prepreint articles. It stores millions of journal articles used across science. It’s also public access, and so we can just scrape the entire thing given enough compute power.
You can download this jupyter notebook to follow along.
Watermark#
Starting in the early 2010s, Matplotlib started including the bytes b"Matplotlib" in every PNG and PDF that they produce. These bytes persist in PDFs that contain Matplotlib plots, including the PDFs stored on arXiv. As a result, it’s pretty simple to check if a PDF contains a Matplotlib image. All we have to do is scan through every PDF and look for these bytes; no parsing required.
Data#
The data is stored in a requester pays bucket at s3://arxiv and on GCS hosted by Kaggle.
The data is about 1TB in size. We’re going to use Dask for this.
This is a good example of writing plain vanilla Python code to solve a problem, running into issues of scale, and then using Dask to easily jump over those problems.
Before you start#
You’ll first need to install the necessary packages. For the purposes of this example, we’ll do this in a new virtual environment, but you could also install them in whatever environment you’re already using for your project.
conda create -n coiled-arxiv -c conda-forge python=3.10 coiled dask s3fs matplotlib
conda activate coiled-arxiv
You also could use pip for everything, or any other package manager you prefer; conda isn’t required.
When you later create a Coiled cluster, your local coiled-arxiv environment will be automatically replicated on your cluster.
Get all filenames#
Our data is stored in a requester pays S3 bucket in the us-east-1 region. Each file is a tar file which contains a directory of papers.
import s3fs
s3 = s3fs.S3FileSystem(requester_pays=True)

directories = s3.ls("s3://arxiv/pdf")
directories[:10]
['arxiv/pdf/arXiv_pdf_0001_001.tar',
 'arxiv/pdf/arXiv_pdf_0001_002.tar',
 'arxiv/pdf/arXiv_pdf_0002_001.tar',
 'arxiv/pdf/arXiv_pdf_0002_002.tar',
 'arxiv/pdf/arXiv_pdf_0003_001.tar',
 'arxiv/pdf/arXiv_pdf_0003_002.tar',
 'arxiv/pdf/arXiv_pdf_0004_001.tar',
 'arxiv/pdf/arXiv_pdf_0004_002.tar',
 'arxiv/pdf/arXiv_pdf_0005_001.tar',
 'arxiv/pdf/arXiv_pdf_0005_002.tar']
len(directories)
7562
There are lots of these
s3.du("s3://arxiv/pdf") / 1e12
3.953831324131
Process one file with plain Python#
Mostly we have to muck about with tar files. This wasn’t hard. The tarfile library is in the stardard library. It’s not beautiful, but it’s also not hard to use.
import tarfile
import io

def extract(filename: str):
    """ Extract and process one directory of arXiv data

    Returns
    -------
    filename: str
    contains_matplotlib: boolean
    """
    out = []
    with s3.open(filename) as f:
        bytes = f.read()
        with io.BytesIO() as bio:
            bio.write(bytes)
            bio.seek(0)
            with tarfile.TarFile(fileobj=bio) as tf:
                for member in tf.getmembers():
                    if member.isfile() and member.name.endswith(".pdf"):
                        data = tf.extractfile(member).read()
                        out.append((
                            member.name,
                            b"matplotlib" in data.lower()
                        ))
            return out
%%time

# See an example of its use
extract(directories[20])[:20]
CPU times: user 3.44 s, sys: 1.28 s, total: 4.72 s
Wall time: 23.1 s
[('0011/cs0011019.pdf', False),
 ('0011/gr-qc0011017.pdf', False),
 ('0011/hep-ex0011095.pdf', False),
 ('0011/cond-mat0011373.pdf', False),
 ('0011/hep-ph0011035.pdf', False),
 ('0011/gr-qc0011082.pdf', False),
 ('0011/cond-mat0011202.pdf', False),
 ('0011/hep-ph0011209.pdf', False),
 ('0011/cond-mat0011038.pdf', False),
 ('0011/gr-qc0011014.pdf', False),
 ('0011/hep-ph0011118.pdf', False),
 ('0011/gr-qc0011095.pdf', False),
 ('0011/astro-ph0011090.pdf', False),
 ('0011/hep-ph0011162.pdf', False),
 ('0011/cs0011010.pdf', False),
 ('0011/cond-mat0011086.pdf', False),
 ('0011/hep-lat0011037.pdf', False),
 ('0011/astro-ph0011369.pdf', False),
 ('0011/astro-ph0011187.pdf', False),
 ('0011/astro-ph0011074.pdf', False)]
Scale function to full dataset#
Great, we can get a record of each file and whether or not it used Matplotlib. Each of these takes about 30 seconds to run on my local machine, which means processing all 7500 files would take around 60 hours.
We can accelerate this in two ways:
Process closer to the data by spinning up resources in the same region on the cloud (this also reduces data transfer costs)
Use hundreds of workers in parallel
We can do this easily with Dask (parallel computing) and Coiled (set up Dask infrastructure)
Create Dask Cluster#
We start a Dask cluster on AWS in the same region where the data is stored.
import coiled

cluster = coiled.Cluster(
    n_workers=100,
    region="us-east-1",  # Local to data.  Faster and cheaper.
    name="arXiv",
)

client = cluster.get_client()
Map function across every directory#
Let’s scale up this work across all of the directories in our dataset
Hopefully it will also be faster because the Dask workers are in the same region as the dataset itself.
%%time

from dask.distributed import wait

futures = client.map(extract, directories)
wait(futures)

# We had one error in one file.  Let's just ignore and move on.
good = [future for future in futures if future.status == "finished"]

lists = client.gather(good)
CPU times: user 21.9 s, sys: 2.2 s, total: 24.1 s
Wall time: 5min 19s
Now that we’re done with the large data problem we can turn off Dask and proceed with pure pandas. There’s no reason to deal with scalable tools if we don’t have to.
# Scale down now that we're done
cluster.shutdown()
Enrich Data#
Let’s enhance our data a bit. The filenames of each file include the year and month when they were published. After extracting this data we’ll be able to see a timeseries of Matplotlib adoption.
# Convert to Pandas

import pandas as pd

dfs = [
    pd.DataFrame(list, columns=["filename", "has_matplotlib"])
    for list in lists
]

df = pd.concat(dfs)

df
| filename | has_matplotlib | |
|---|---|---|
| 0 | 0001/astro-ph0001477.pdf | False |
| 1 | 0001/hep-th0001095.pdf | False |
| 2 | 0001/astro-ph0001322.pdf | False |
| 3 | 0001/cond-mat0001159.pdf | False |
| 4 | 0001/astro-ph0001132.pdf | False |
| ... | ... | ... |
| 630 | 9912/math9912098.pdf | False |
| 631 | 9912/math9912251.pdf | False |
| 632 | 9912/solv-int9912013.pdf | False |
| 633 | 9912/hep-th9912254.pdf | False |
| 634 | 9912/hep-th9912272.pdf | False |
2477917 rows × 2 columns
def date(filename):
    year = int(filename.split("/")[0][:2])
    month = int(filename.split("/")[0][2:4])
    if year > 80:
        year = 1900 + year
    else:
        year = 2000 + year

    return pd.Timestamp(year=year, month=month, day=1)

date("0005/astro-ph0001322.pdf")
Timestamp('2000-05-01 00:00:00')
Yup. That seems to work. Let’s map this function over our dataset.
df["date"] = df.filename.map(date)
df.head()
| filename | has_matplotlib | date | |
|---|---|---|---|
| 0 | 0001/astro-ph0001477.pdf | False | 2000-01-01 |
| 1 | 0001/hep-th0001095.pdf | False | 2000-01-01 |
| 2 | 0001/astro-ph0001322.pdf | False | 2000-01-01 |
| 3 | 0001/cond-mat0001159.pdf | False | 2000-01-01 |
| 4 | 0001/astro-ph0001132.pdf | False | 2000-01-01 |
Plot#
Now we can just fool around with Pandas and Matplotlib.
df.groupby("date").has_matplotlib.mean().plot(
    title="Matplotlib Usage in arXiv",
    ylabel="Fraction of papers"
).get_figure().savefig("results.png")
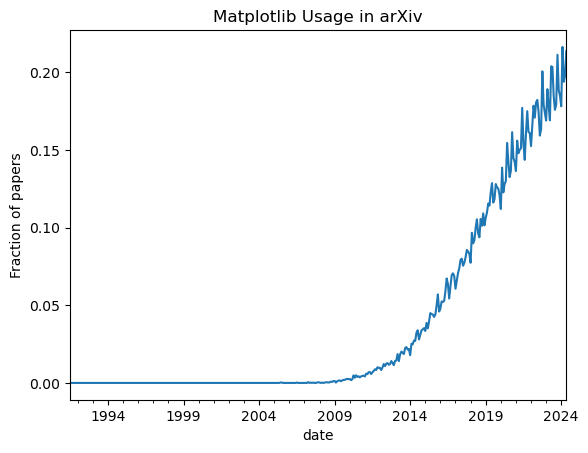
I did the plot above. Then Thomas Caswell (matplotlib maintainer) came by and, in true form, made something much better 🙂
import datetime
import matplotlib.pyplot as plt
from matplotlib.ticker import PercentFormatter

import pandas as pd

# read data
by_month = df.groupby("date").has_matplotlib.mean()


# get figure
fig, ax = plt.subplots(layout="constrained")
# plot the data
ax.plot(by_month, "o", color="k", ms=3)

# over-ride the default auto limits
ax.set_xlim(left=datetime.date(2004, 1, 1))
ax.set_ylim(bottom=0)

# turn on a horizontal grid
ax.grid(axis="y")

# remove the top and right spines
ax.spines.right.set_visible(False)
ax.spines.top.set_visible(False)

# format y-ticks a percent
ax.yaxis.set_major_formatter(PercentFormatter(xmax=1))

# add title and labels
ax.set_xlabel("date")
ax.set_ylabel("% of all papers")
ax.set_title("Matplotlib usage on arXiv")
Text(0.5, 1.0, 'Matplotlib usage on arXiv')
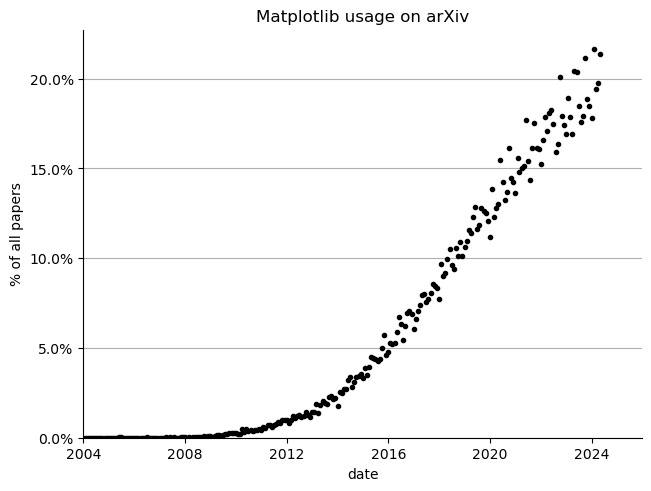
Yup. Matplotlib is used pretty commonly on arXiv. Go team. These are available at the github repository mrocklin/arxiv-matplotlib if you want to play around with them.
Conclusion#
Matplotlib + arXiv#
It’s incredible to see the steady growth of Matplotlib across arXiv. It’s worth noting that this is all papers, even from fields like theoretical mathematics that are unlikely to include computer generated plots. Is this matplotlib growing in popularity? Is it Python generally?
For future work, we should break this down by subfield. The filenames actually contained the name of the field for a while, like “hep-ex” for “high energy physics, experimental”, but it looks like arXiv stopped doing this at some point. My guess is that there is a list mapping filenames to fields somewhere though. The filenames are all in the Pandas dataframe / parquet dataset, so doing this analysis shouldn’t require any scalable computing.
Dask + Coiled#
Dask and Coiled were built to make it easy to answer large questions.
We started this notebook with some generic Python code. When we wanted to scale up we invoked Dask+Coiled, did some work, and then tore things down, all in about ten minutes. The problem of scale or “big data” didn’t get in the way of us analyzing data and making a delightful discovery.
This is exactly why these projects exist.