Scheduler Running Out of Memory#
The Dask scheduler coordinates the whole workload and controls the workers so that a computation can be executed as efficiently as possible.
The scheduler receives the task graph from the client and calculates the computational plan that defines the order in which tasks are executed. The scheduler also keeps track of the state of the workers and the tasks that are currently being processed. After the computation is finished, the scheduler pulls the result from the worker and sends it back to the client machine.
Coiled runs the scheduler on a separate machine from the workers for Dask clusters to ensure that the scheduler isn’t blocked by computations that are running on the workers. This means that it has dedicated resources it can use to do its job.
The scheduler is a critical component of the cluster and thus it is important that it is responsive and can handle the workload that is thrown at it. Out of memory errors on the scheduler are thus detrimental for the health of the cluster. This section goes through the most common causes we have seen for a scheduler that runs out of memory.
Troubleshooting large task graphs#
The first main cause of the scheduler running out of memory is a task graph that is too large for the available memory. This is normally accompanied by a warning on the client machine that looks like:
UserWarning: Sending large graph of size 762.94 MiB.
This may cause some slowdown.
Consider scattering data ahead of time and using futures.
This can be seen in the Coiled UI by going to the Metrics tab and selecting the
SCHEDULER option in the memory chart.
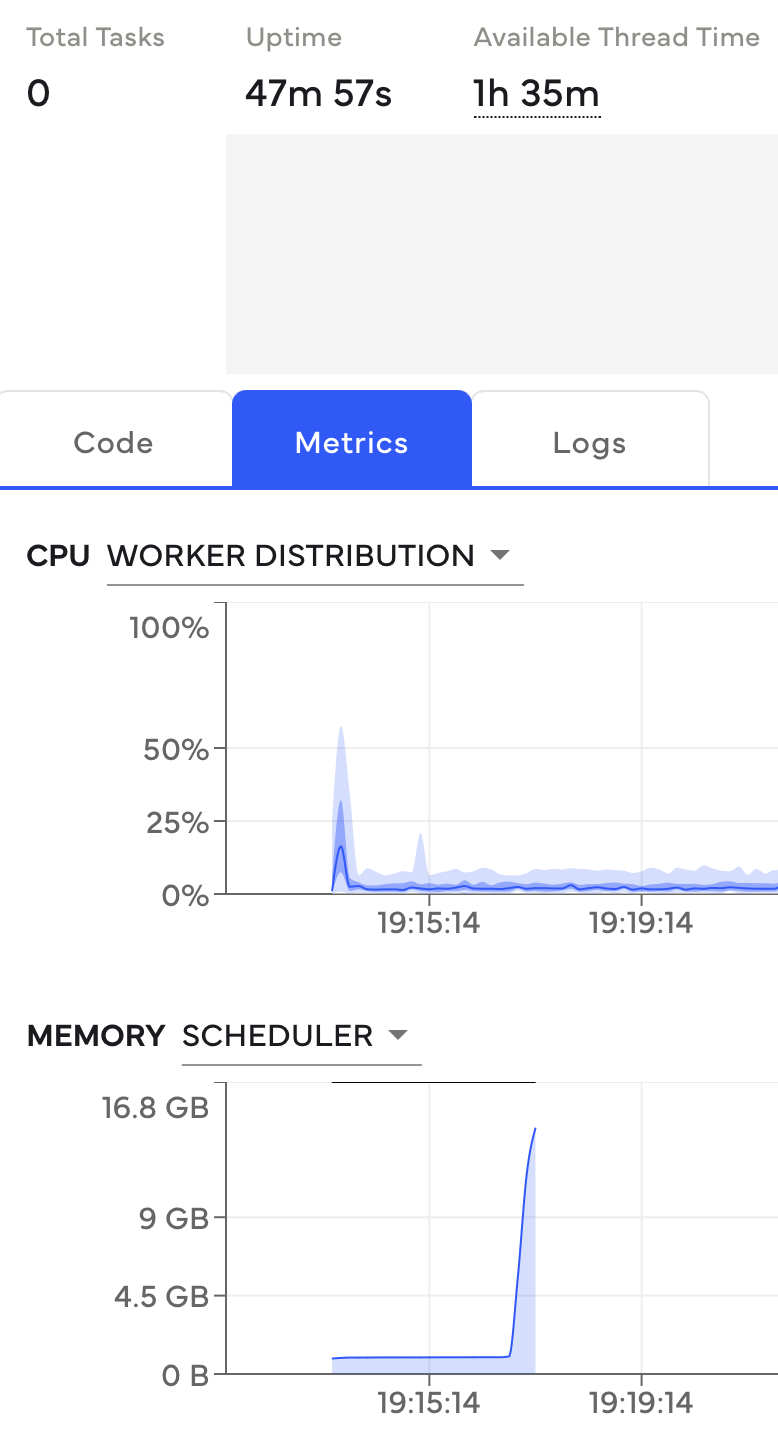
The memory on the scheduler spikes before anything is happening. This is a strong signal that the task graph is very large. This is normally accompanied by the warning described above.#
The scheduler errors with out of memory errors
before the actual computation starts if the task graph is the cause of this error. You can
see this through the task counter that is normally 0 if the first computation causes this
or if the new computation-block hasn’t started yet, i.e. if your computation isn’t registered
on the Code tab.
There are different root causes that can be responsible for this. The most common is that large objects, like a pandas DataFrame or a NumPy Array are embedded into the task graph. This can be solved through Loading the Data with Dask directly instead of embedding them into the task graph.
Additionally, this can be caused by a very large task graph (significantly over a million tasks). This is most often caused by tiny partitions or chunks and can be solved through creating bigger partitions or chunks in your datasets.
If the scheduler is still struggling with memory pressure, you should choose a larger instance for the scheduler that has more memory available. The best way to increase scheduler memory is usually to move to a memory optimized instance. It has twice as much memory available per core and the scheduler is normally only using a single core, so that more cores won’t increase performance. For example, the memory optimized instances are the r-families on AWS.
Troubleshooting compute on large collections#
Alternatively, another common cause of out of memory errors on the scheduler is when compute
is called on a large collection, i.e. a large Array or DataFrame. Dask pulls all the data
to the scheduler before sending it to the client.
This pattern can be identified through the Coiled UI memory chart. The spike in memory happens after the computation is finished in this case.
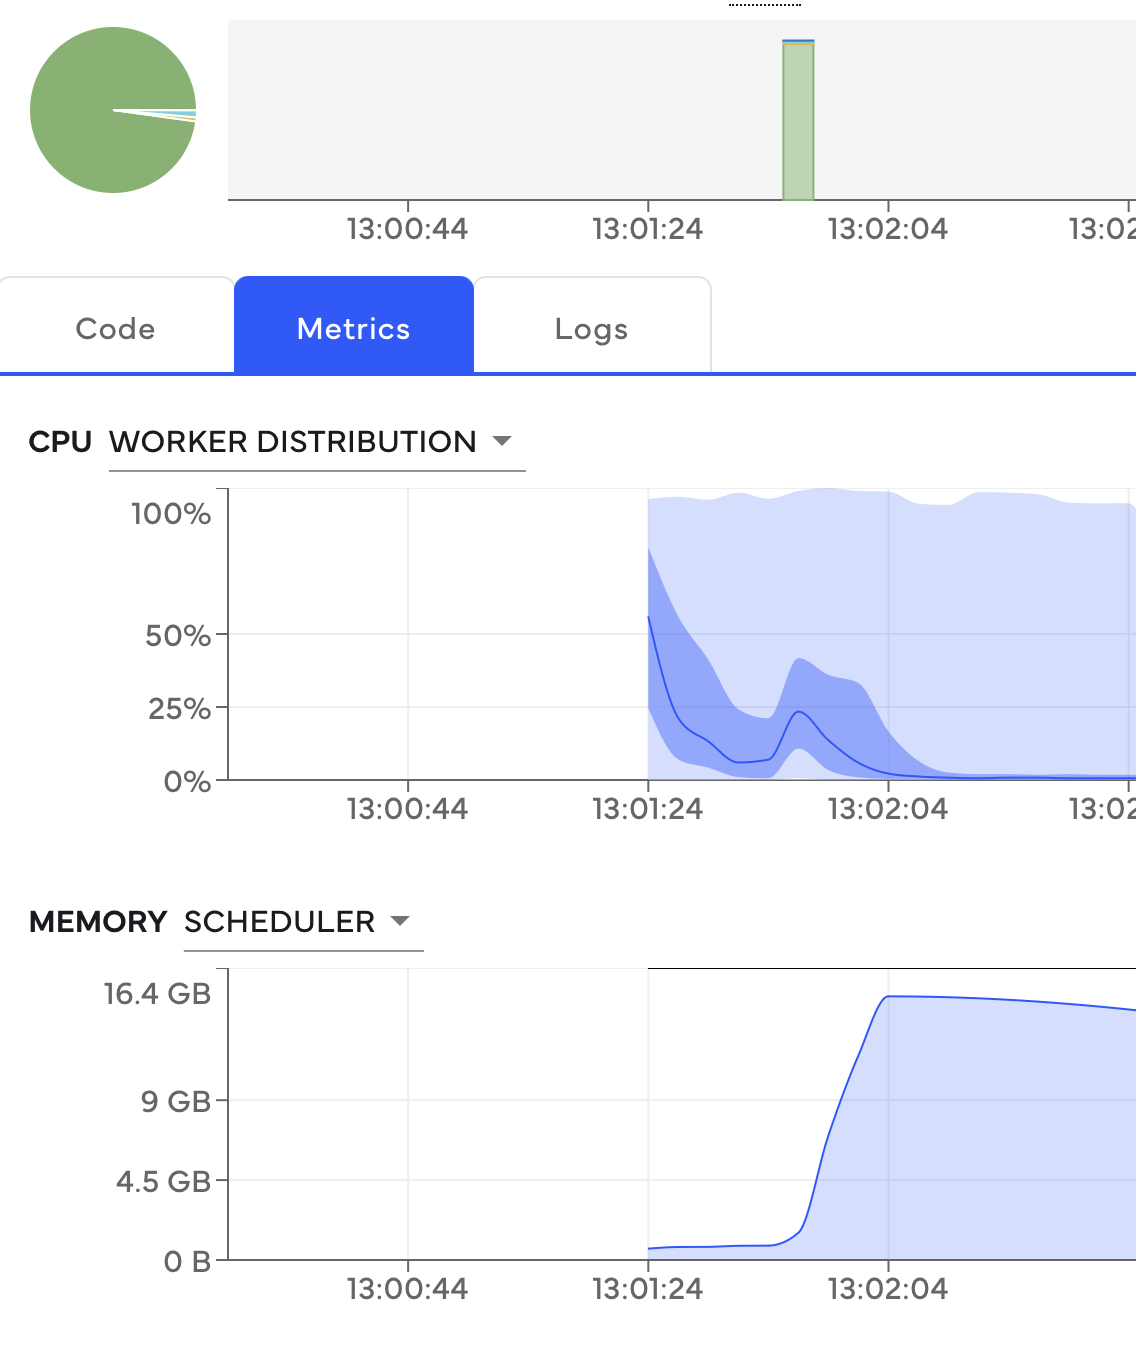
The memory spike on the scheduler happens immediately after the computation is finished. This is illustrated by the green bar in the graph.#
We don’t recommend calling compute on large Dask collections. Apart from causing out of memory
errors on the scheduler, it will also slow down a computation because the data has to be sent
to your local machine. Instead, we recommend waiting to trigger a computation until the collection is
reduced to a manageable size through a reducer like mean or sum. Generally, if you have
an ETL-like workload, we recommend keeping the data completely on the cluster and writing to the
required storage system with Dask.
Please reach out to us if your out of memory errors don’t fit into this pattern or if the described solutions don’t solve your problem. These errors can be tricky to debug in certain scenarios.