Logging#
Coiled stores system, scheduler, and worker logs in your cloud provider account using Amazon CloudWatch and Google Cloud Logging (see the sections on AWS and GCP). While you can use any of your existing log management systems to access your logs, Coiled also offers a few ways to make this easier.
Note
This page covers cluster and system logs. To learn more about understanding your Dask computations, see our documentation on Performance Reports.
Coiled cloud#
Regardless of whether you are launching a Coiled cluster interactively or from a Python script, you can view logs from the Coiled cloud web application.
From your clusters dashboard, you can select a specific cluster and you’ll be redirected to the clusters information page at https://cloud.coiled.io/clusters/<cluster-id>.
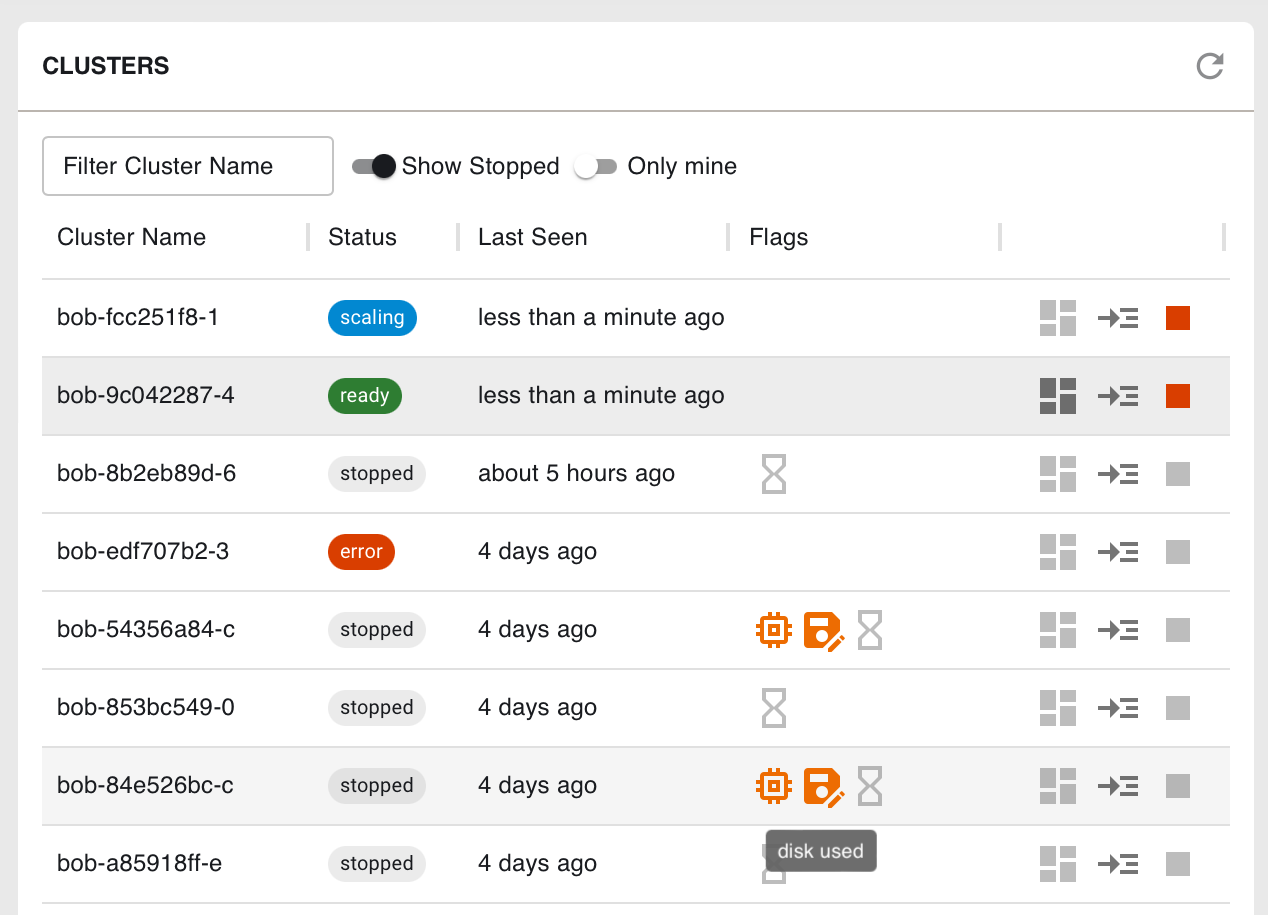
Cluster dashboard (click to enlarge)#
You can select the Logs tab to see your system logs and Dask scheduler and worker logs.
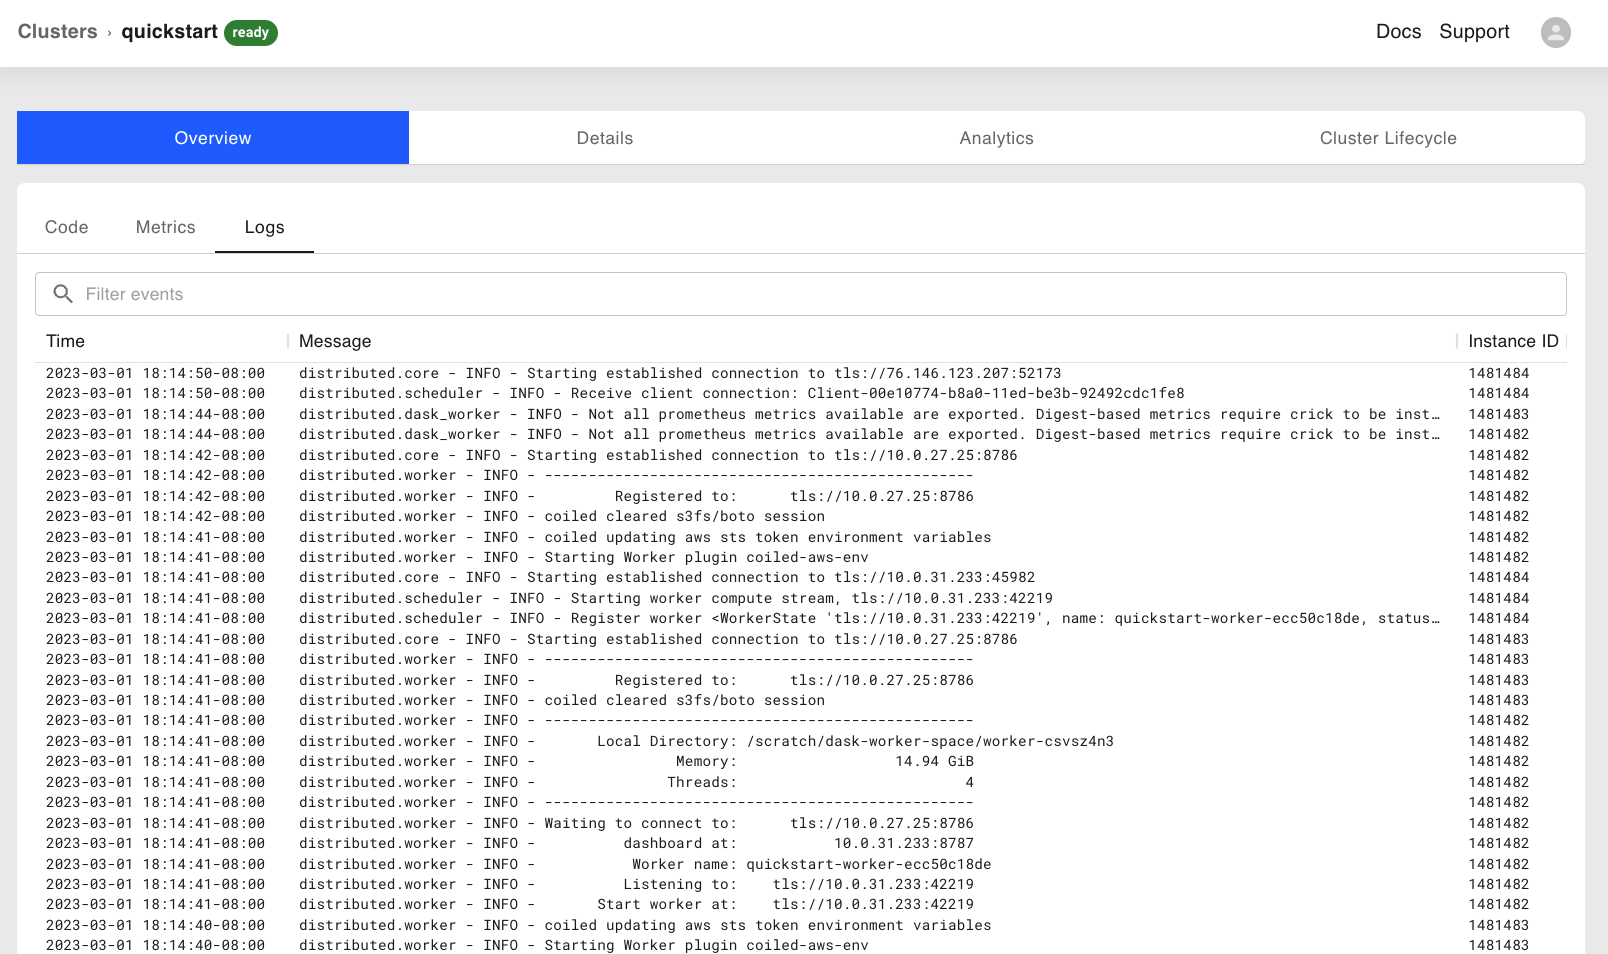
Cluster Logs (click to enlarge)#
You can also see an overview of your cluster lifecycle as infrastructure is created and torn down from the Cluster Lifecycle tab.
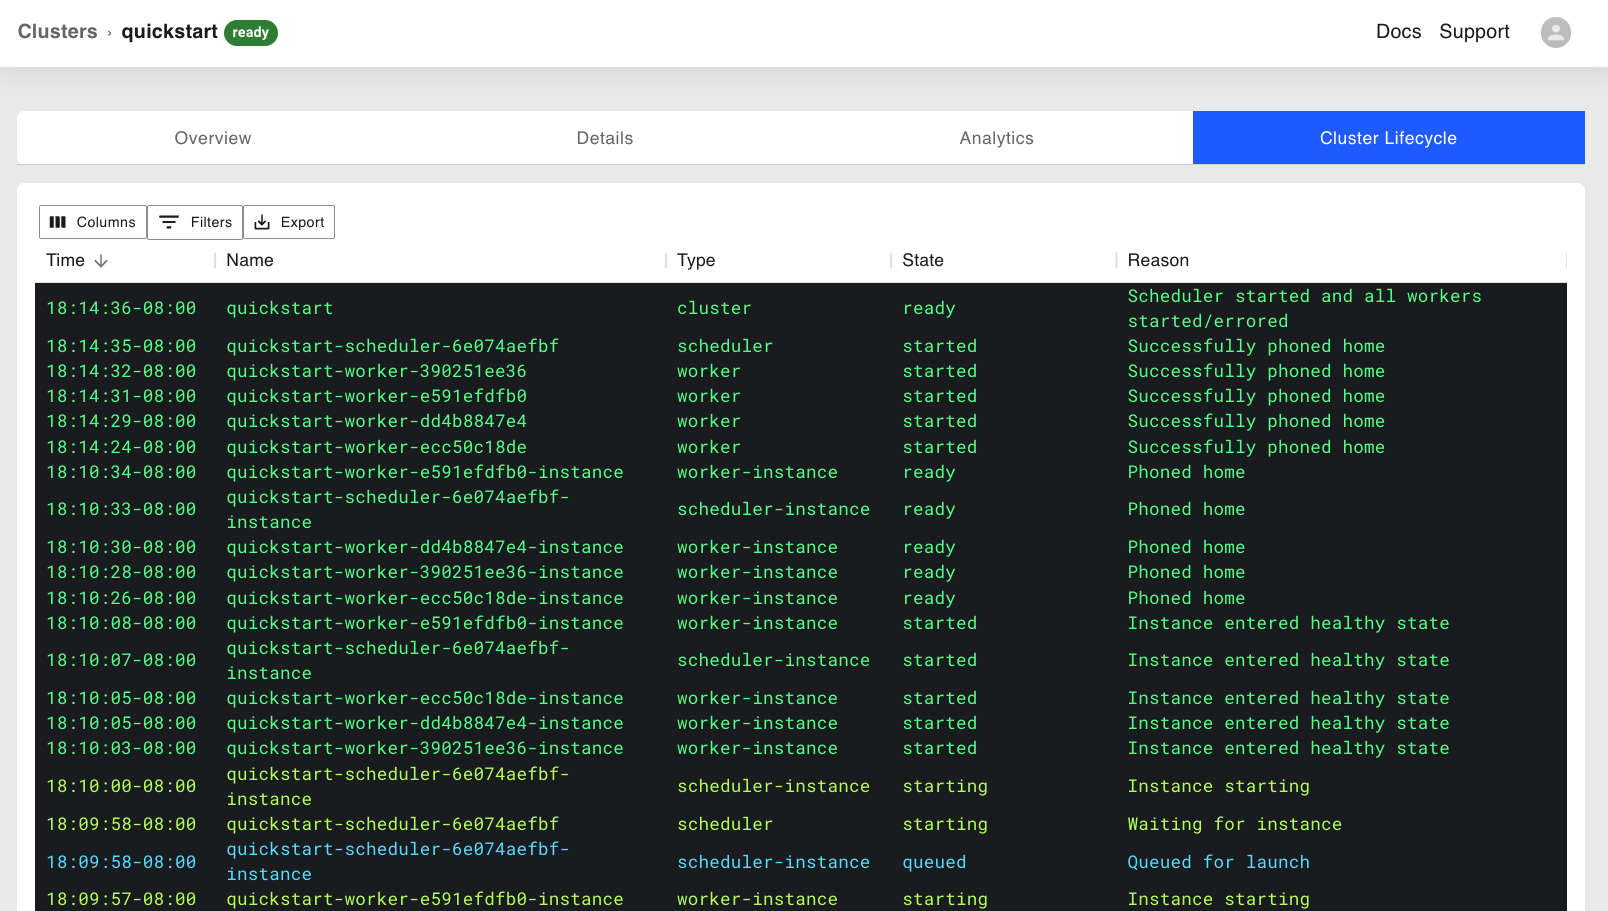
Cluster Lifecycle (click to enlarge)#
CLI Tool#
In addition to using the Coiled Cloud web application, you can pull logs from the command-line with coiled cluster logs. There are a number of options, including the ability to filter log messages:
coiled cluster logs --cluster <your-cluster-id> --filter "starting"
You can also filter by the timestamp using --since, which accepts a time delta (e.g. --since 5m1s) or a timestamp (e.g. --since "2023-03-01 18:42:47").
coiled cluster logs --cluster <your-cluster-id> --since 5ms
If you don’t specify the cluster, you’ll see your most recent cluster, so if you have an active cluster, you can easily watch logs as they come by running:
coiled cluster logs --tail
coiled cluster logs#
coiled cluster logs [OPTIONS] [CLUSTER_ARG]
Options
- --account, --workspace <account>#
Coiled workspace (uses default workspace if not specified). Note: –account is deprecated, please use –workspace instead.
- --cluster <cluster>#
Cluster for which to show logs, default is most recent
- --no-scheduler#
Don’t include scheduler logs
- --workers <workers>#
All worker logs included by default, specify ‘none’ or comma-delimited list of names, states, or internal IP addresses
- --label <label>#
- Options:
private_ip_address | name | id | public_ip_address | none
- --system#
Just show system logs
- --combined#
Show combined system and dask logs
- --tail#
Keep tailing logs
- --since <since>#
By default will show logs from start of cluster (or 30s ago if tailing)
- --until <until>#
Show logs up to and including this time, by default will go through present time.
- --filter <filter>#
Filter log messages
- --color, --no-color#
Use for color in logs
- --show-all-timestamps#
Prepend datetime to all log messages
- --interval <interval>#
Tail polling interval
Arguments
- CLUSTER_ARG#
Optional argument
Interactive session#
Within an interactive session, e.g. IPython or Jupyter Notebook, there is a dynamic widget loaded when you first create the cluster:
The widget has three panels showing an overview of the Coiled cluster, the configuration, and Dask worker states with progress bars for how many workers have reached a given state. You can also use the link at the top to view the cluster dashboard mentioned above.
Python script#
If you aren’t creating Coiled clusters interactively, then you may want to set up logging from within a Python script. This can be especially helpful for those running Coiled from within a workflow orchestration tool, for example.
Coiled uses the Python standard logging module for logging changes in cluster, scheduler, and worker state. The default level is WARNING, but you can control the logging verbosity by setting the logging level, the DEBUG and INFO levels being the most verbose. See the Python logging docs for more on logging levels. Here is an example for how this can be configured from within a Python script:
import logging
import coiled

logging.basicConfig(level=logging.INFO)
logging.getLogger("coiled").setLevel(logging.INFO)

cluster = coiled.Cluster()
client = cluster.get_client()

# run your Dask computations

client.close()
cluster.close()
The above snippet will print the logs to the console, but you can also choose to save logs to a file by changing the parameters passed to basicConfig() (see this tutorial on logging to a file).
Next steps#
For more advanced options in debugging your Dask computations, see the Dask documentation on logging.