Memory Pressure on Dask Clusters#
Dask monitors memory usage on every worker and has built in thresholds which control the execution of the worker. These thresholds ultimately aim to avoid hard out-of-memory errors on the workers that corrupt the state of the VM.
Dask will start spilling to Disk if possible at 60% used memory by default, but this is not always an option and not always fast enough to avoid further memory building up on the worker.
The first threshold is at 80% of the available memory on the worker and leads to Dask pausing the worker to avoid an increase of used memory on the worker. This stops new tasks from being executed on the worker but does not interrupt tasks that are already processing. The tasks can accumulate additional memory which can lead the worker to trigger the next threshold.
The second threshold is at 95% of the available memory on the worker. Dask will restart the worker if it exceeds 95% of the memory budget that was allocated to it. Restarting the worker will force Dask to re-compute the tasks that were held in memory on this worker and repeat the tasks that were currently being processed when the worker was restarted.
Constantly restarting workers will slow down the execution of the workload significantly and can lead to an interruption of the whole computation if the workers are not able to complete the computation.
Identifying and Alleviating Memory Pressure#
This section goes through the most common cases of memory pressure and how to identify them. It also provides some guidance on how to alleviate the memory pressure.
The easiest way of identifying memory pressure on one of your cluster and to diagnose
the root cause is going to the Metrics tab in the Coiled UI and select the
DISTRIBUTION (HOST MEMORY) option in the Memory chart.
The most common reason for memory pressure is that the whole cluster is under memory pressure and the dataset just doesn’t fit into the available memory on the cluster.
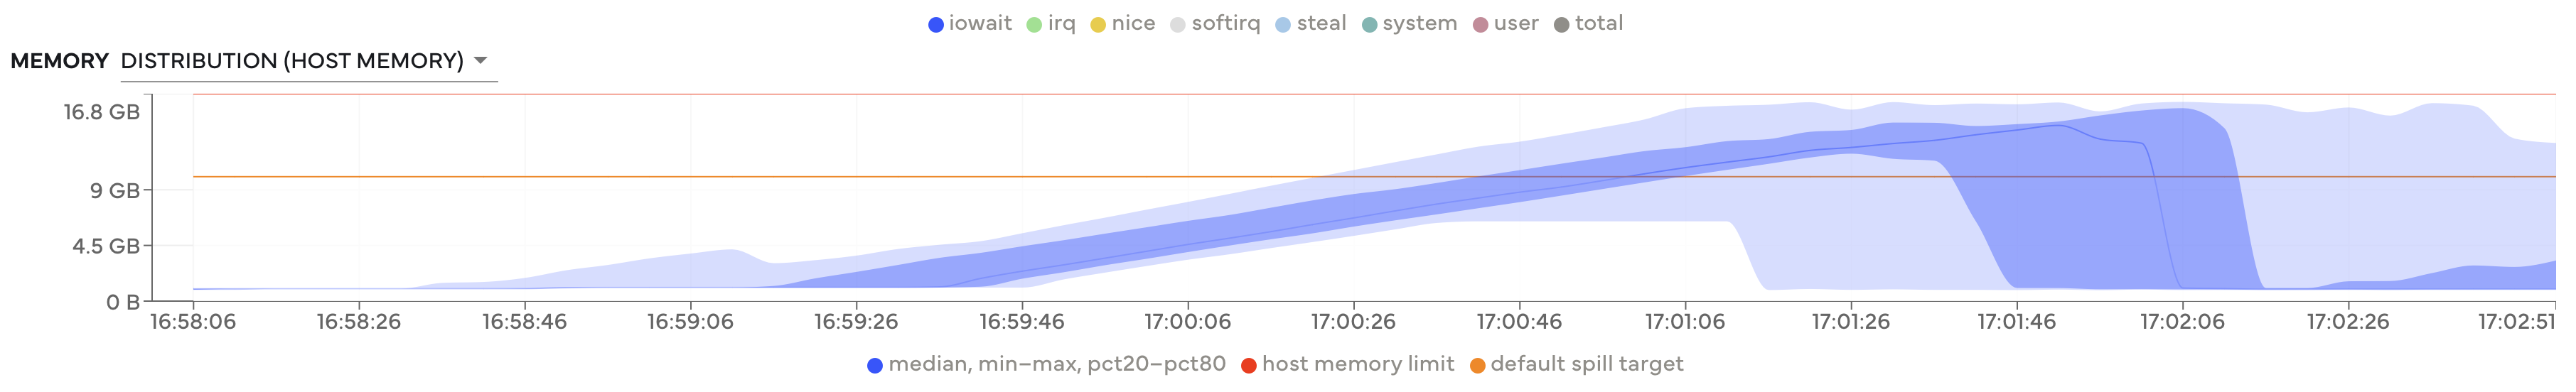
All workers are approaching the memory limit#
Dask can process datasets that are significantly larger than the available memory, but some workloads require Dask to hold all data into memory at once. The first step in this scenario should be to increase the available memory on the cluster through one of the following options with decreasing preference:
Choosing the memory optimized instance type with the same number of cores.
Increasing the number of workers. This will also improve the performance since the cluster will have more cores available to process the workload.
Choosing a larger instance type. Dask doesn’t perform as well on larger instances, so this should be the last option.
Reaching out to us if neither of these options work.
The memory optimized instances normally have twice as much memory per core available compared to the standard instance that is the default on Coiled. This ensures that every Dask task also has double the amount of memory available. For example, the memory optimized instances are the r-family on AWS.
Note
A common culprit of this pattern is the usage of the persist function in Dask. The
persist function will load all data up to the point where it is called. persist
is rarely needed and should be avoided if possible.
Another root cause for this pattern can be that the individual tasks are too large to fit into memory. The memory profile will look very similar to the one above, but adding more workers won’t necessarily solve this problem. We observe this often in embarassingly parallel workloads where the individual tasks are too large to fit into memory.
The best solution to address this is to choose memory optimized instances from the cloud provider.
Additionally, reducing the number of threads on each worker can help to alleviate the memory
pressure if memory optimized instances are not sufficient. This can be done by setting
worker_options={"nthreads": n} in the coiled.Cluster constructor where n is
lower than the number of cores.
Another cause for restarted workers are unevenly sized partitions or chunks. Having partitions or chunks that have a significantly bigger size than others can cause single workers to run into memory pressure while the others are idle.
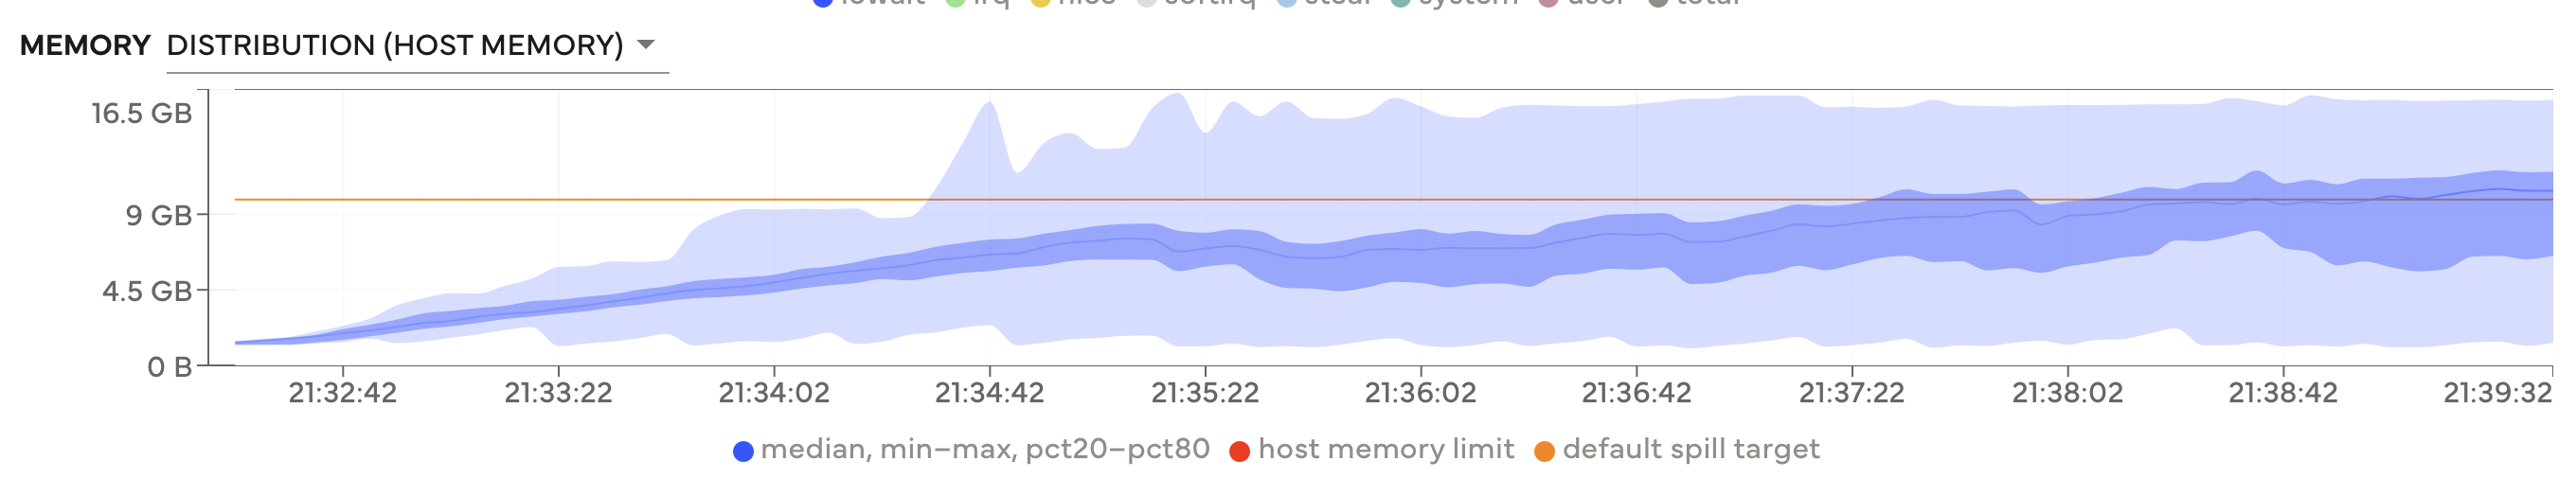
Most workers don’t suffer from memory pressure but some outliers are close to the limit#
The most reliable and efficient way to solve this long term is to ensure that
individual tasks are evenly sized. This can be achieved by using the rechunk function
for arrays, repartition for DataFrames or manual work if you are using a lower
level API. Alternatively, using memory optimized instances is again another good
approach. It will increase the room for memory spikes of individual tasks.