Jan 6, 2023
7m read
AWS Cost Explorer Tips and Tricks#
Nat Tabris
Spending time in AWS Cost Explorer is one of the best ways to understand what’s going on in your AWS account. It’s one of the few places in the AWS Console where you can get a global view of your account or even of your entire organization.
In this post, I’m going to share some views that I’ve found especially useful when digging in to our costs for running data-science workloads on EC2 instances. Along the way, you might also learn some ways to reduce those costs.
Before we dig in, let’s talk about some basics. You can access Cost Explorer by logging in to the AWS Console and following this link (or going to the “AWS Cost Management” service and clicking “Cost Explorer” in the side menu).
Cost Explorer provides ways to filter and group your cost data. You can select time ranges, and you can see hourly, daily, and monthly costs, although hourly data (and other fine-grained views) are only available for more recent costs.
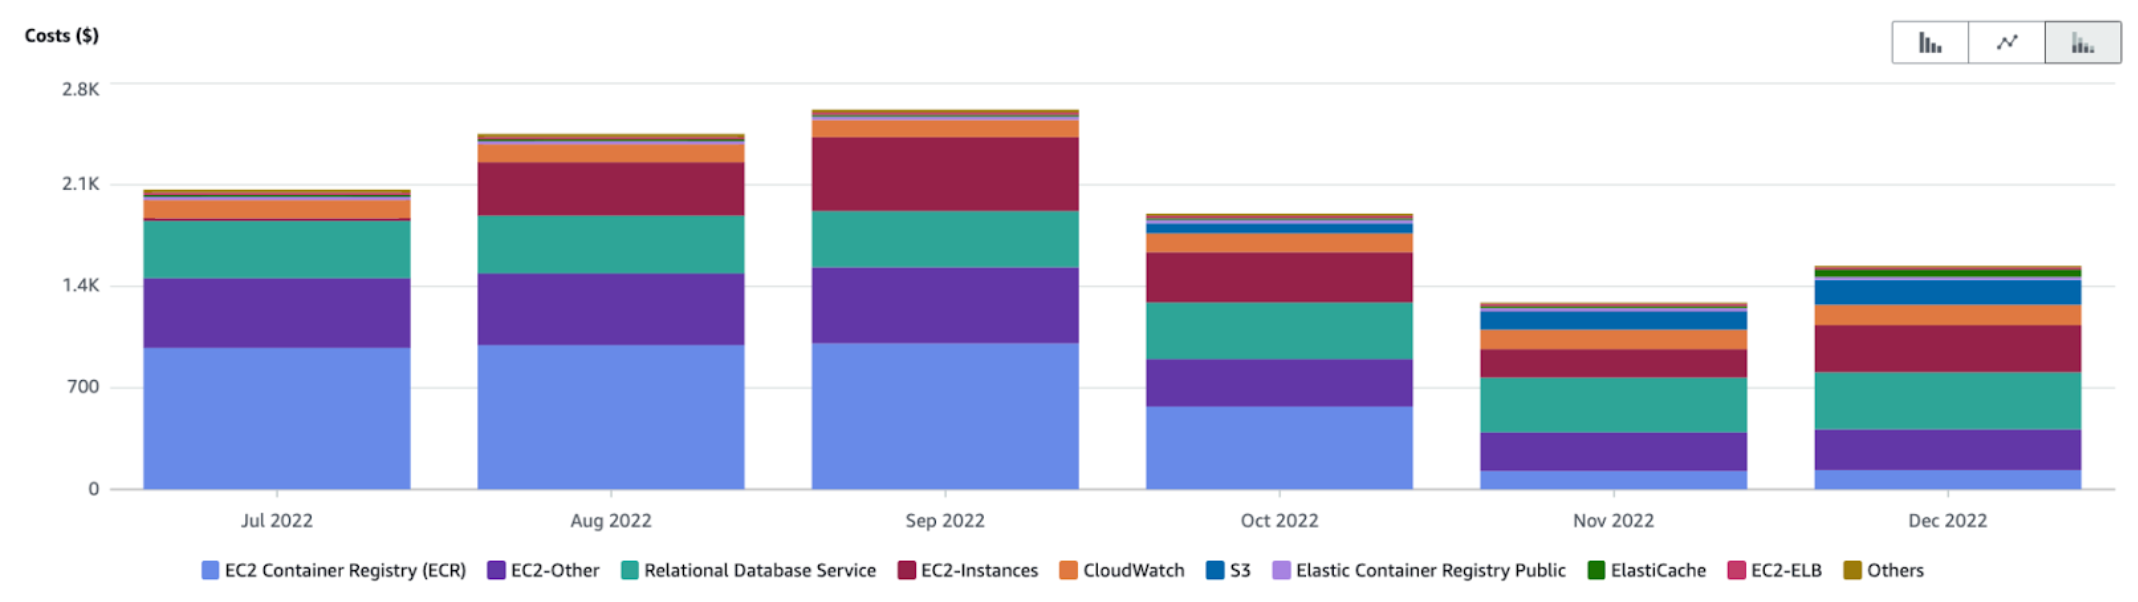
For a high-level view, I often start by disabling all filters and grouping by “Service”:
and then by “Region”:
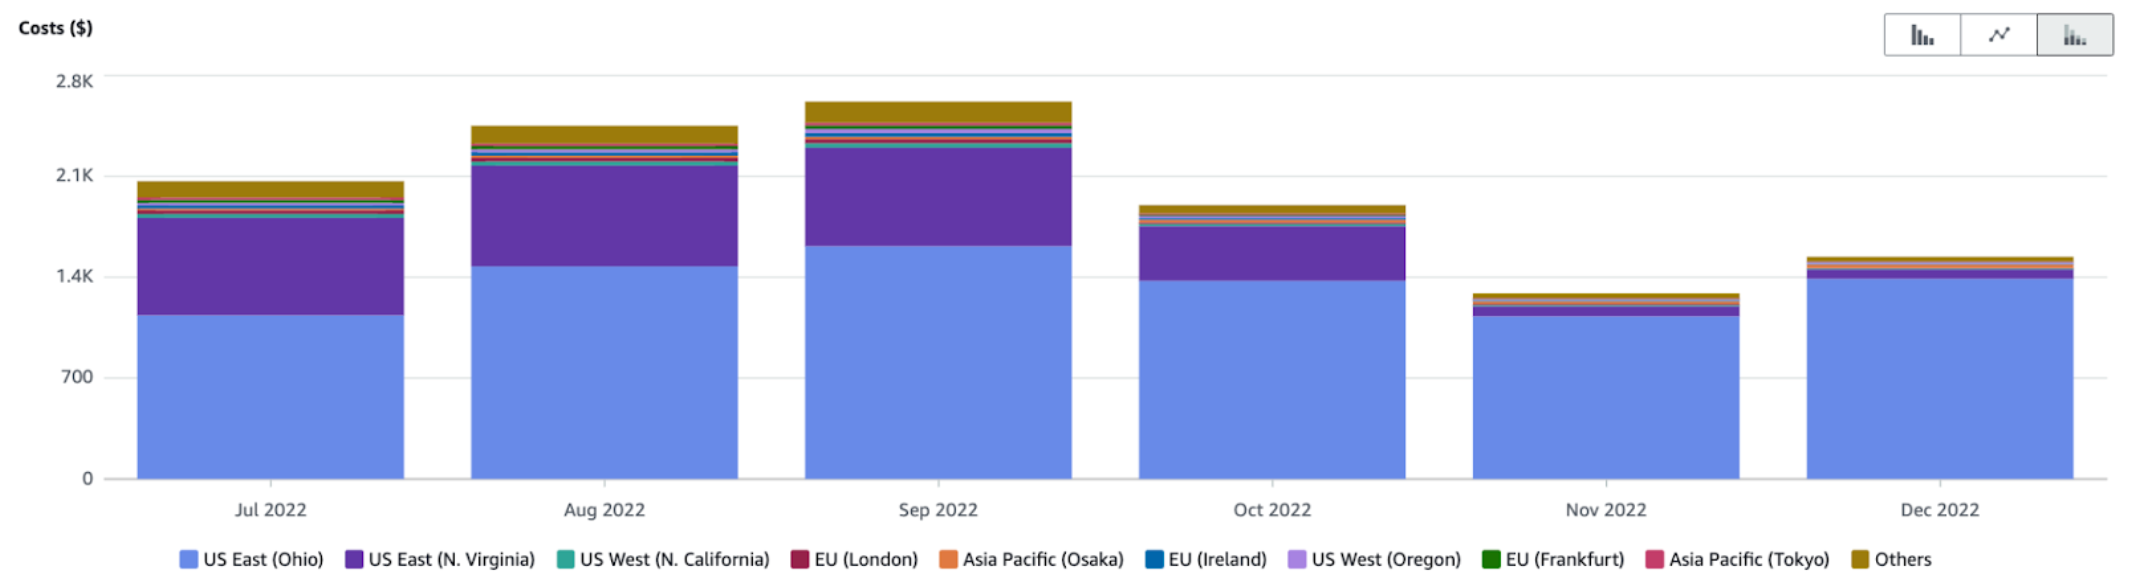
Depending on what you see, you might want to explore in more depth by (e.g.) filtering to a specific region and looking at the breakdown by service for just that region. Or filter to a service and then grouping by region to see where the service is being used.
AWS Cost Explorer has powerful filtering and grouping functions. Powerful—but also not entirely intuitive.
At Coiled we make lots of clusters of EC2 instances for running big-data computations at scale. I personally spend a lot of time in AWS Cost Explorer trying to understand and optimize costs related to these clusters. In this post, I’ll explain the most helpful ways I’ve found for finding and understanding these costs. I’ll also share some tips I’ve learned about how to reduce these costs.
A brief word from our sponsors: Coiled makes it very easy to scale up your Python code in the cloud. We deploy in your AWS or Google Cloud account, and we configure the infrastructure so that you get sensible security and cost-savings by default. If you have Python code that you need to run at scale, give us a try!
Spot vs On Demand Instance Usage#
Group by |
Filters |
|---|---|
Purchase option |
Service: EC2-Instances |
If you want to see cost and hours, add “Usage type” filter to everything that includes “Box” or “Spot”. (Open the Usage type filter dropdown, type “box” and click select all. Then type “spot” and click select all again. Now apply and you should get usage in hours for both on demand “box” and spot instances.)
Cost savings tip: As you can see, spot is a great way to save money! In December, our usage hours for on demand is very low, yet this accounts for over half of our cost. See this blog post for our approach to using spot instances well.
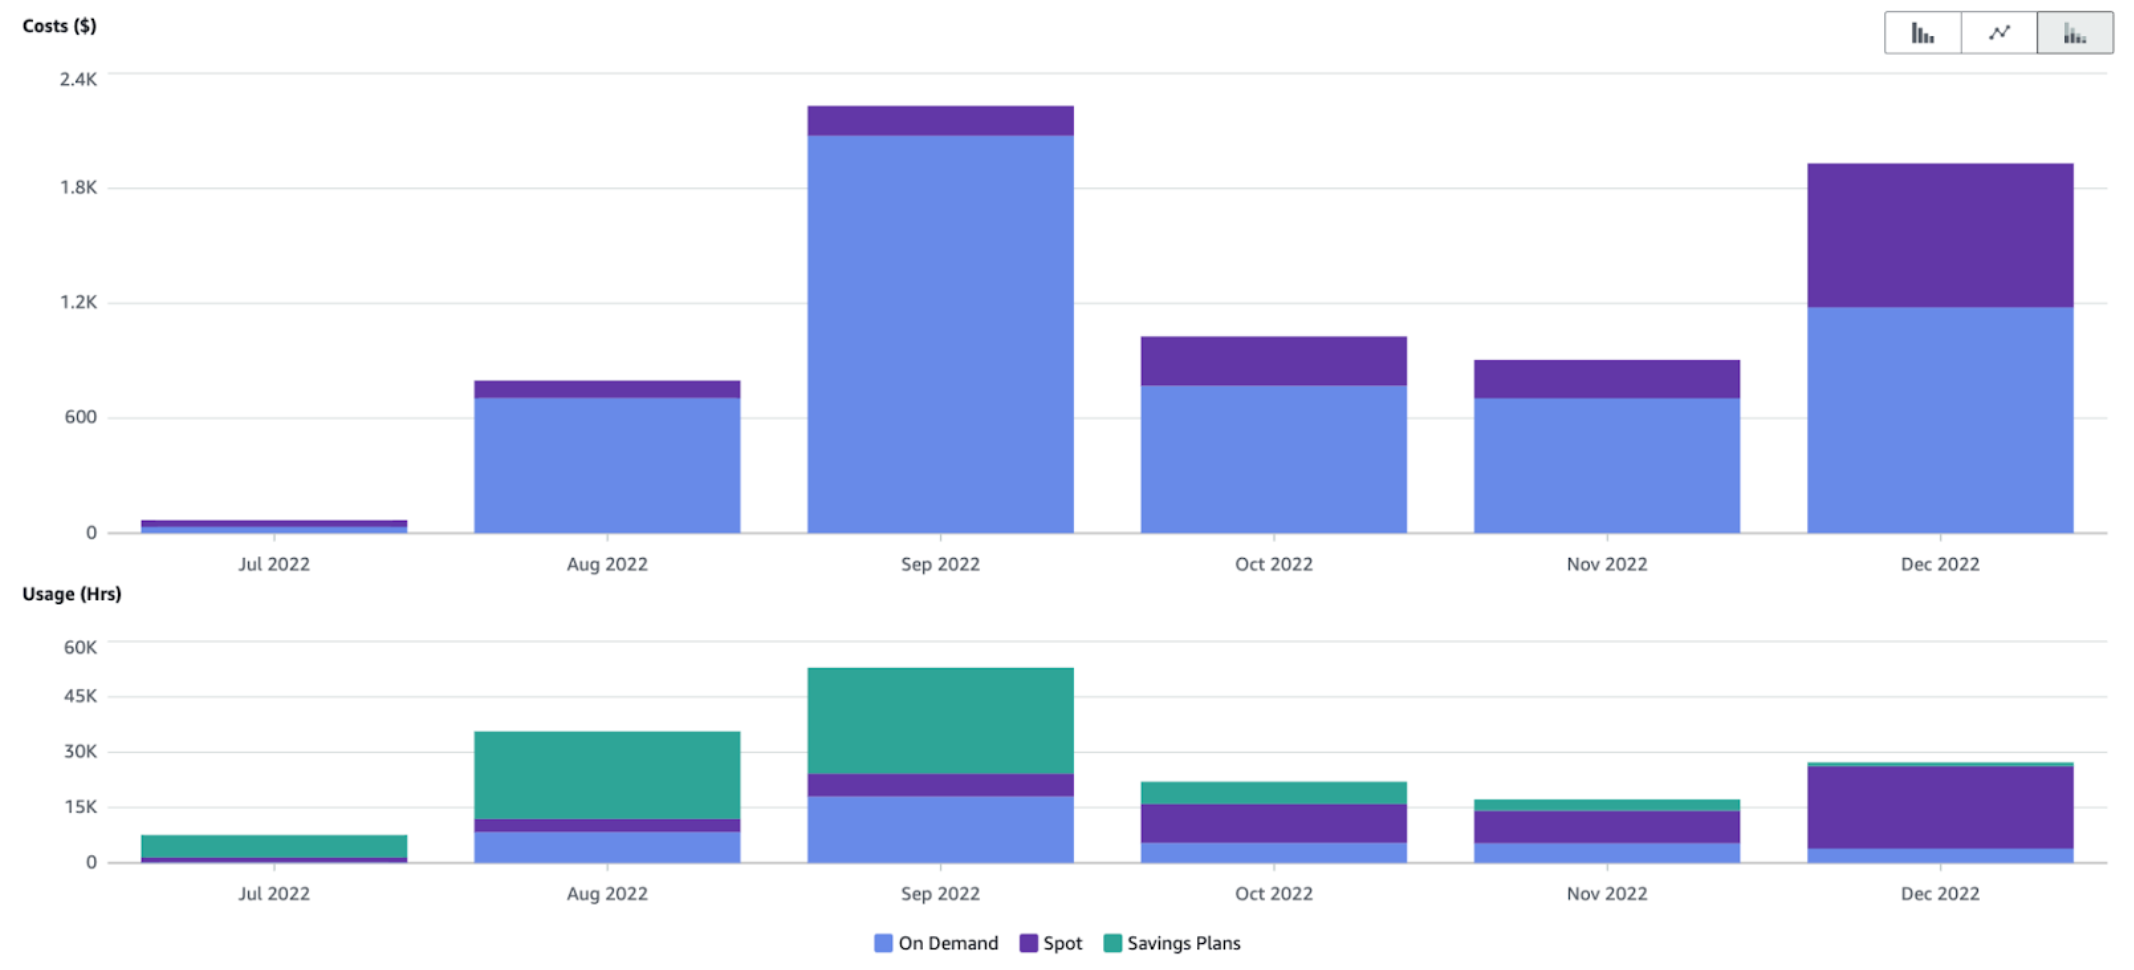
Once you’ve logged in to the AWS Console, here’s a link to bring up this view for your own AWS account: Spot vs On Demand (by month, July–December 2022)
Instance Types#
Same as the Spot vs On Demand, but group by Instance type.
Group by |
Filters |
|---|---|
Instance type |
Service: EC2-Instances |
If you want to see cost and hours, add “Usage type” filter to everything that includes “Box” or “Spot”.
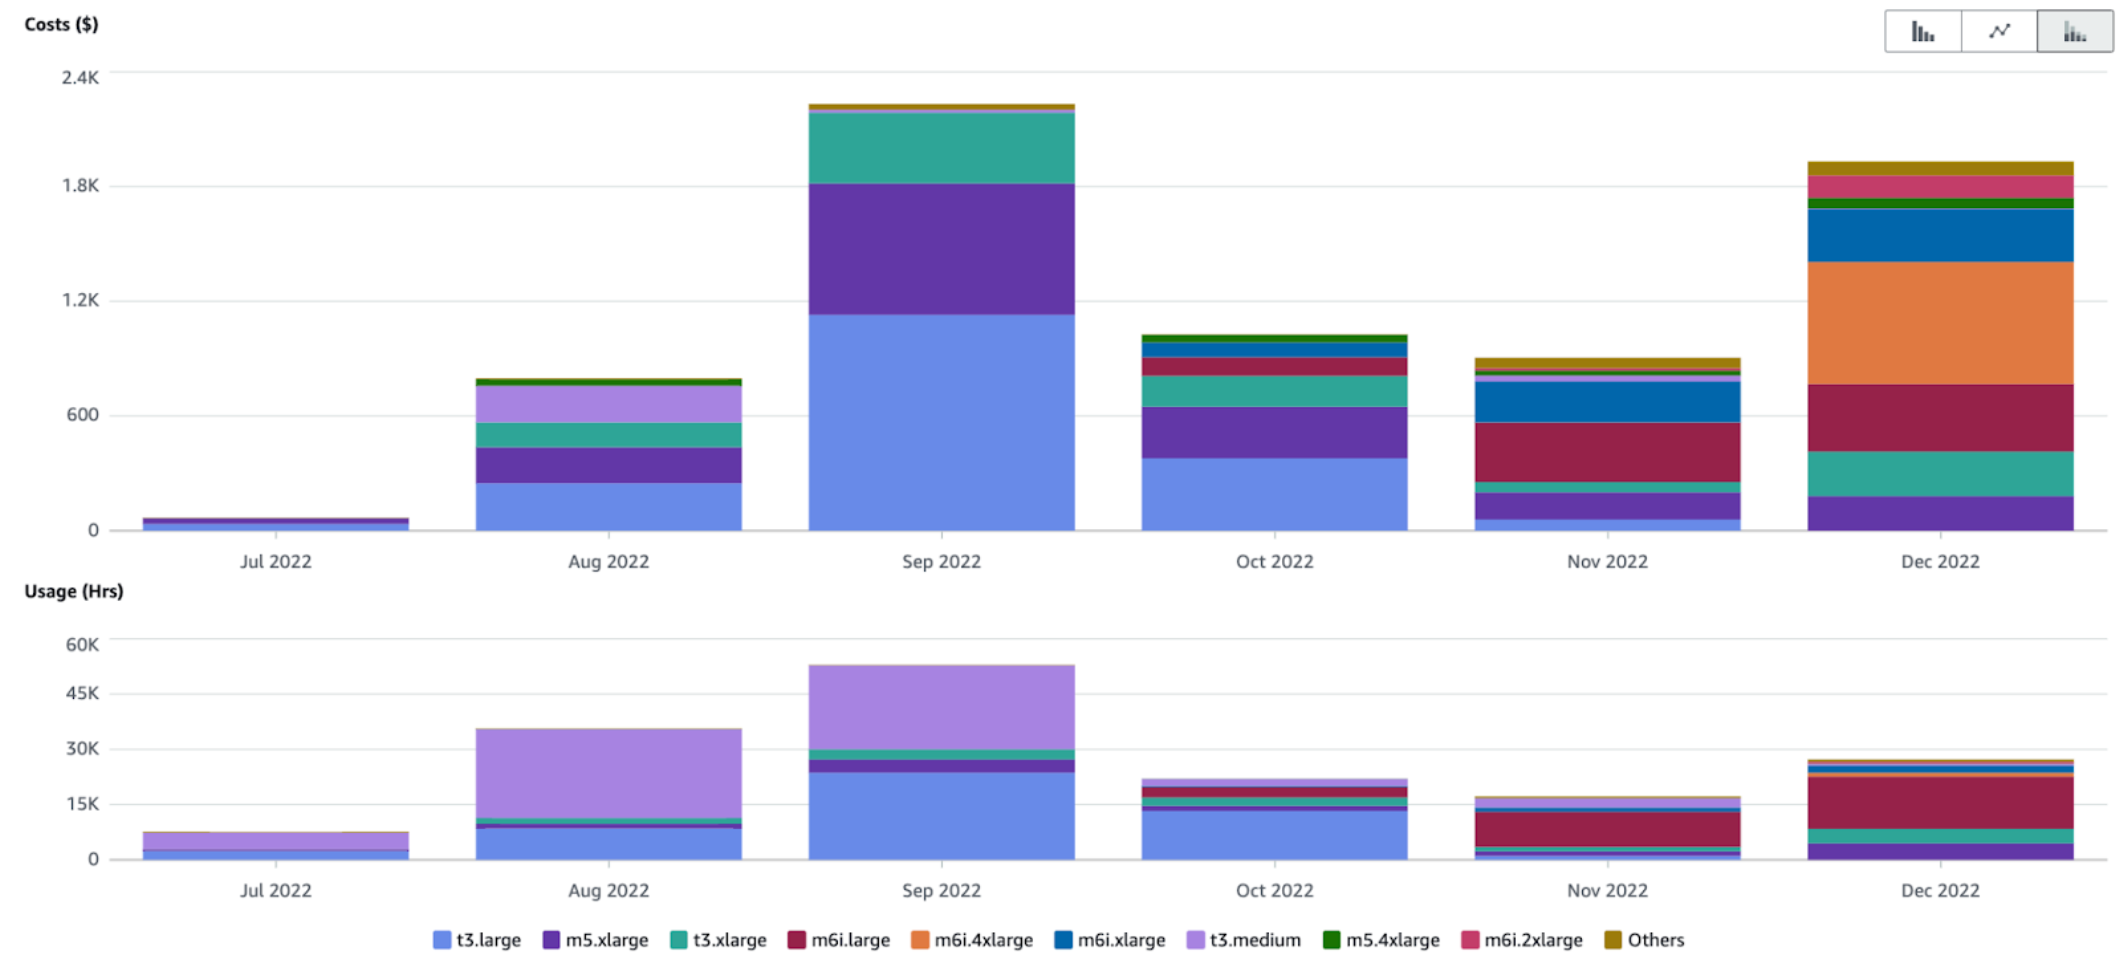
See this in your own AWS account: Instance types (by month, July–December 2022)
Burstable Instances#
In addition to the base cost for burstable instances (t2/t3/t4g), you might pay extra if you use more than the “baseline” of CPU util.
When you have burstable instances and are using less than the baseline, you’ll accumulate credits that you use when you go above the baseline. But if you burst more than your accumulated credits, you’ll pay extra, and that’s what we’re looking at here.
Group by |
Filters |
|---|---|
Usage type |
Service: EC2 - Other |
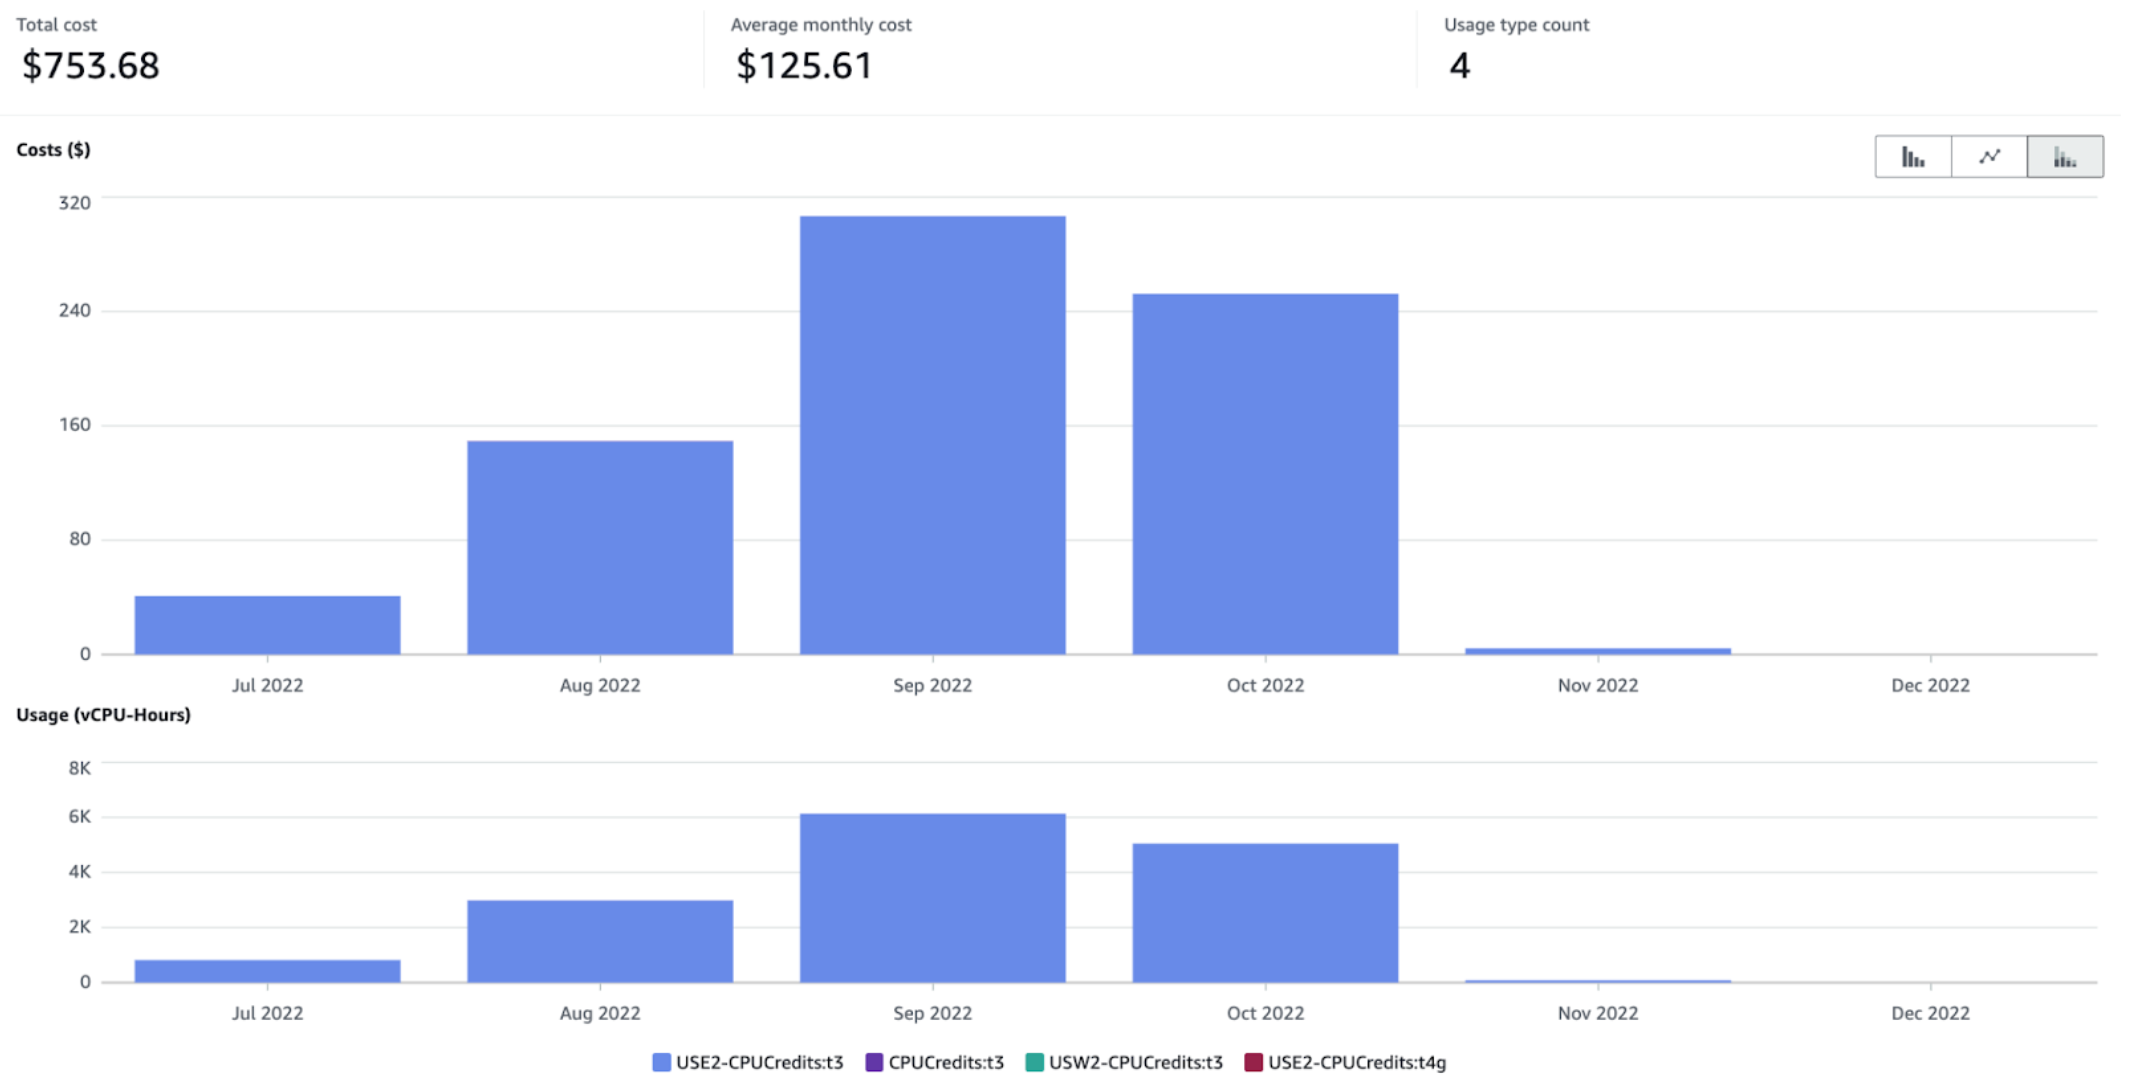
See this in your own AWS account: Extra burst credits (by month, July–December 2022)
Cost savings tip: As you can see, extra burst credits can be expensive for CPU-intensive workloads! We’ve found that by switching from t3 to m6i instance types we’ve significantly reduced our AWS bill. See this blog post for more details.
EBS Disks#
Group by |
Filters |
|---|---|
Usage type |
Usage type: include everything with “EBS” |
This will show both cost and usage in GB-Months. (See AWS docs for details about EBS pricing.)
Note that if you have Amazon Machine Images (AMIs), these often are backed by EBS snapshots so will be shown here under “SnapshotUsage”.
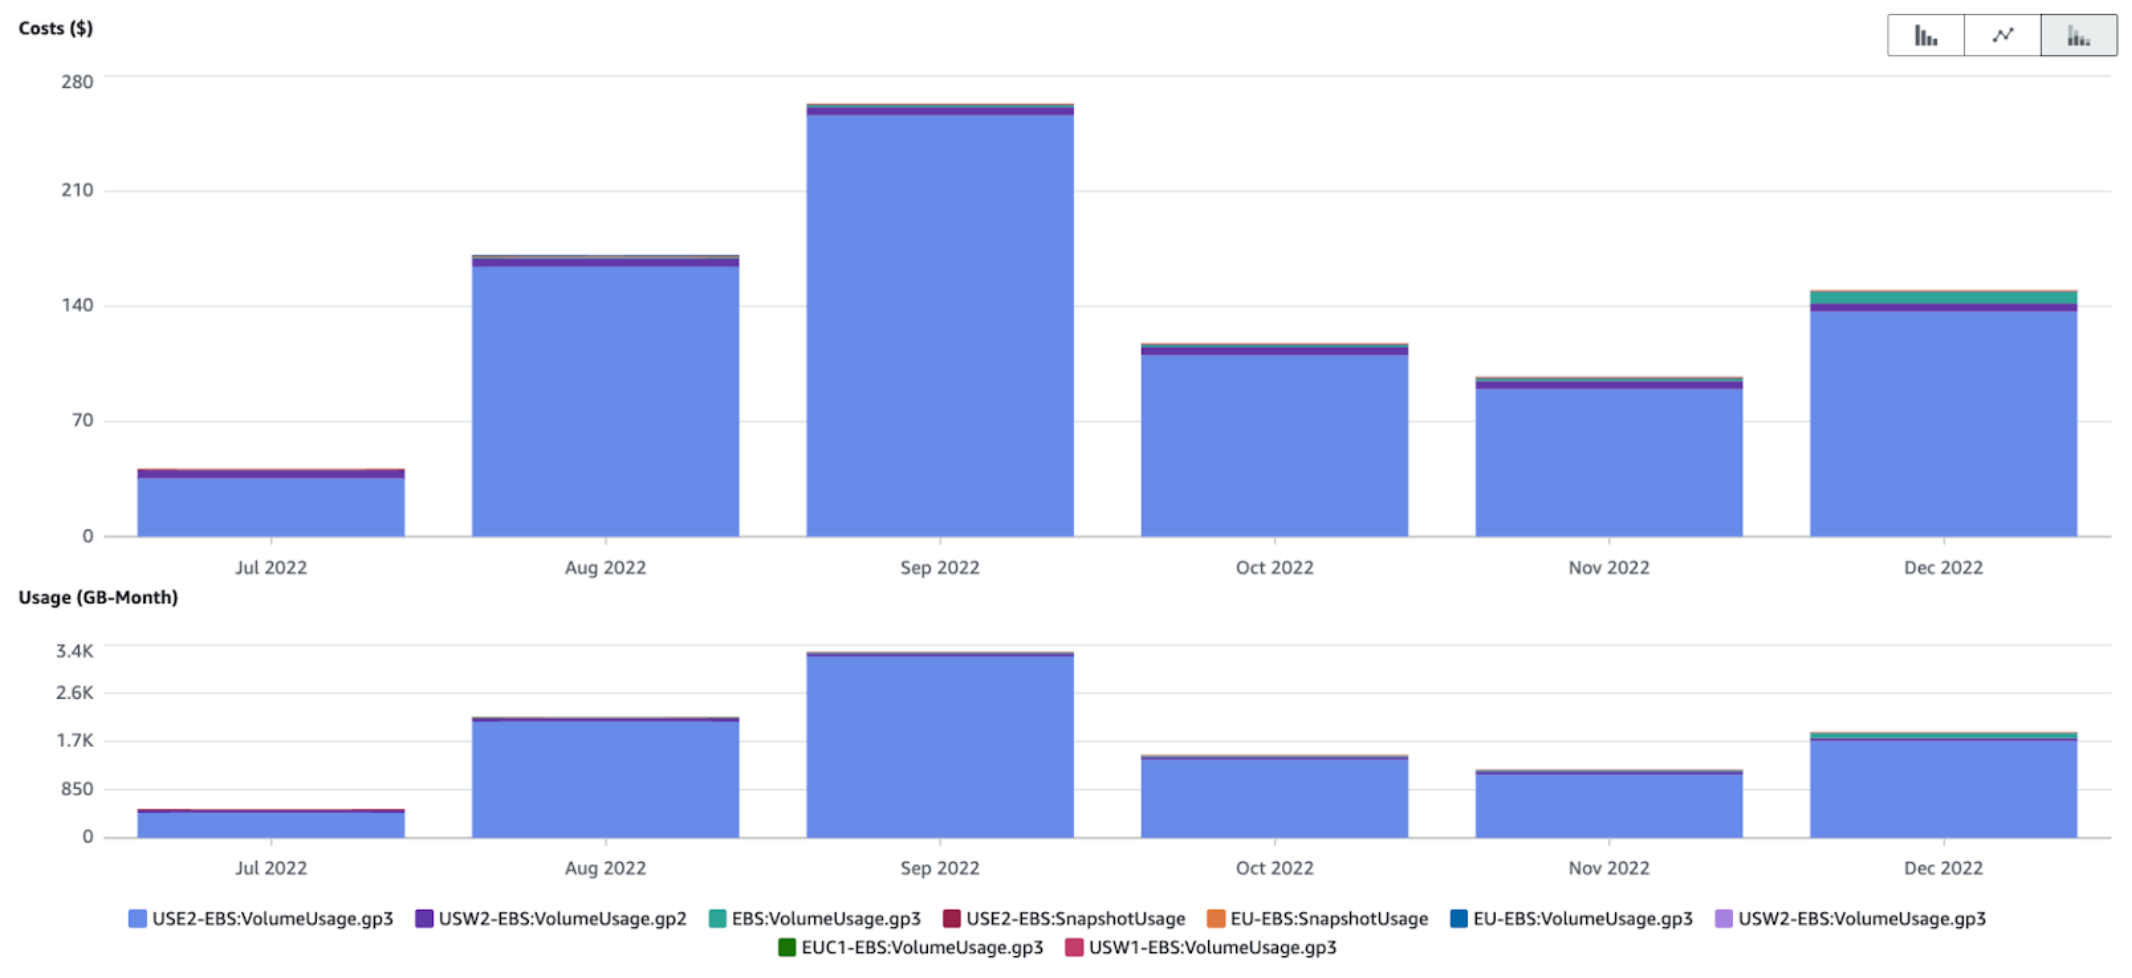
See this in your own AWS account: EBS (by month, July–December 2022)
Cost savings tip: EBS is relatively cheap compared to EC2 but can still add up. In September our cost for compute was about $2200 and our cost for EBS disks was about $250. We’ve reduced these costs by using smaller disks as the default (with the option to increase disk size for specific workloads).
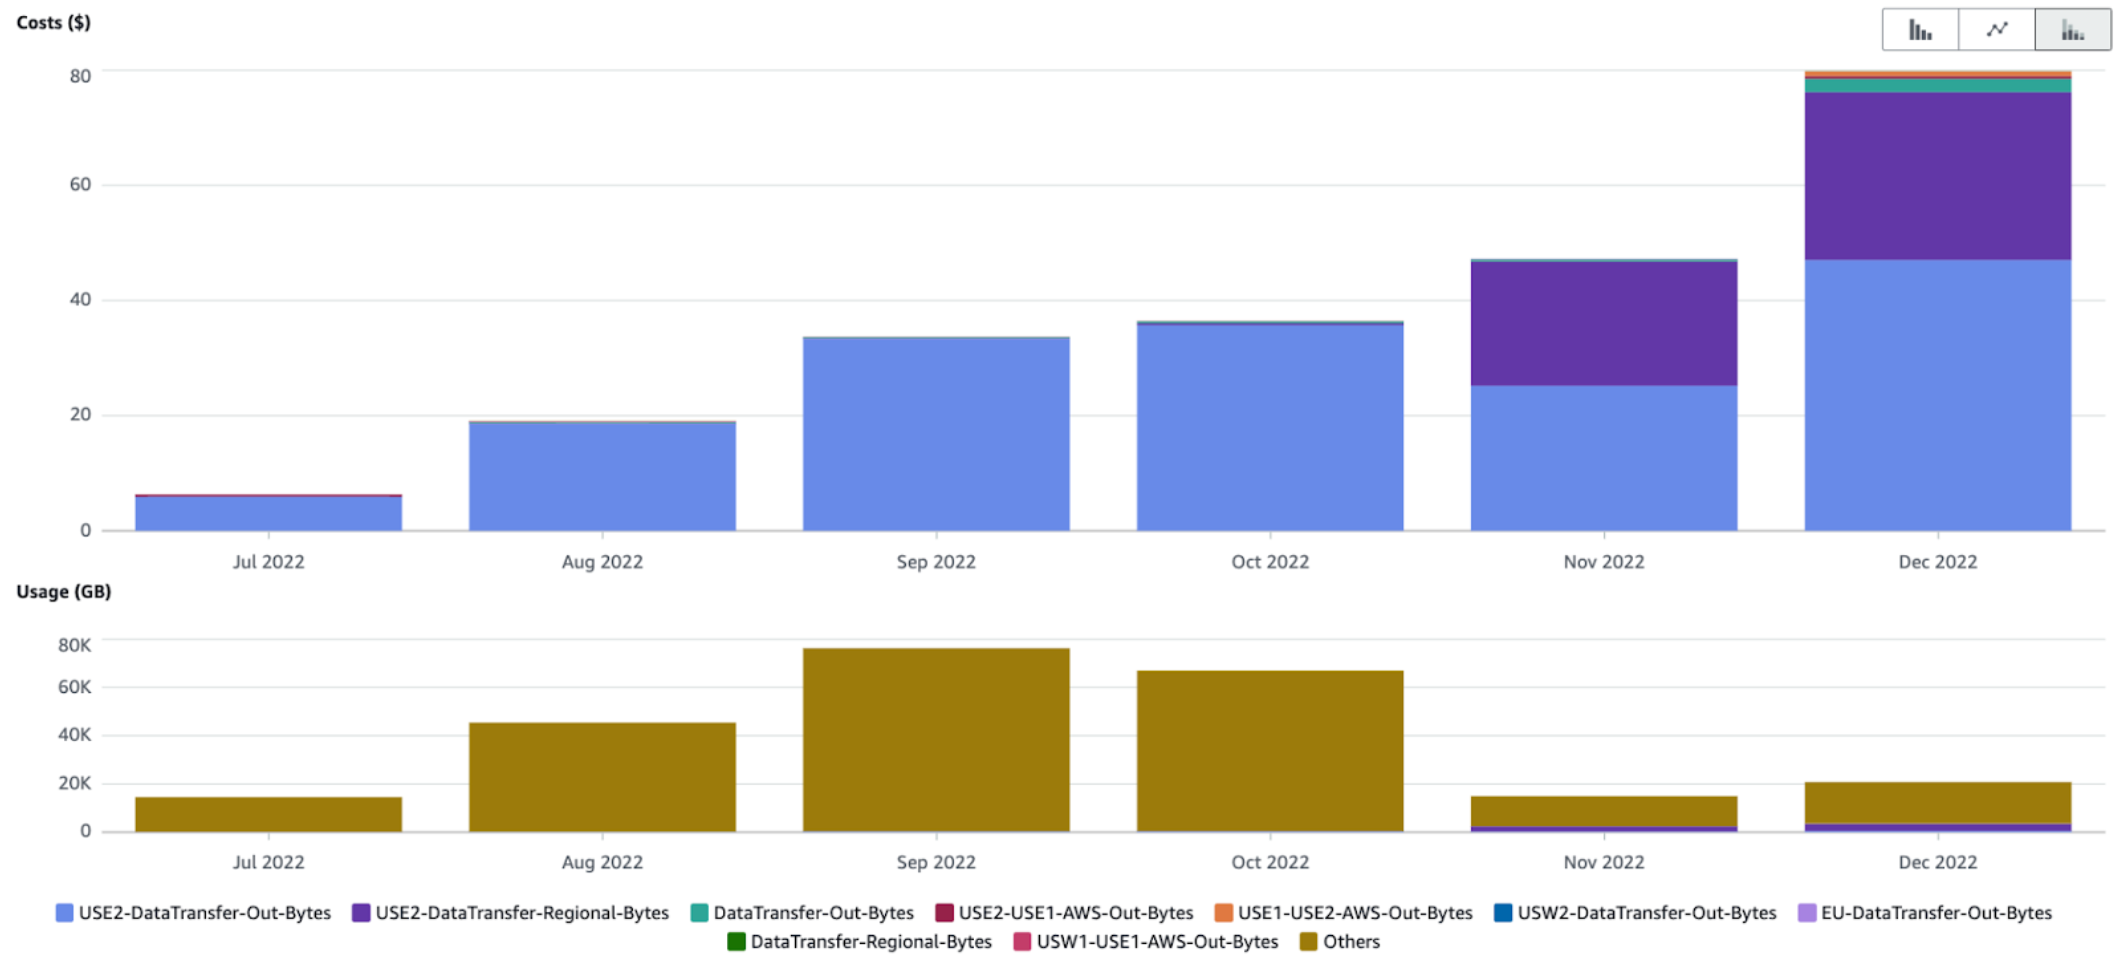
Network traffic for EC2 instances#
You pay for moving data from AWS to the internet, you pay for moving data between regions, and you pay for moving data between zones inside a region.
For reasons unknown to me, most types of traffic are listed under “EC2-Instances” service but interzone traffic shows under the “EC2 - Other” service.
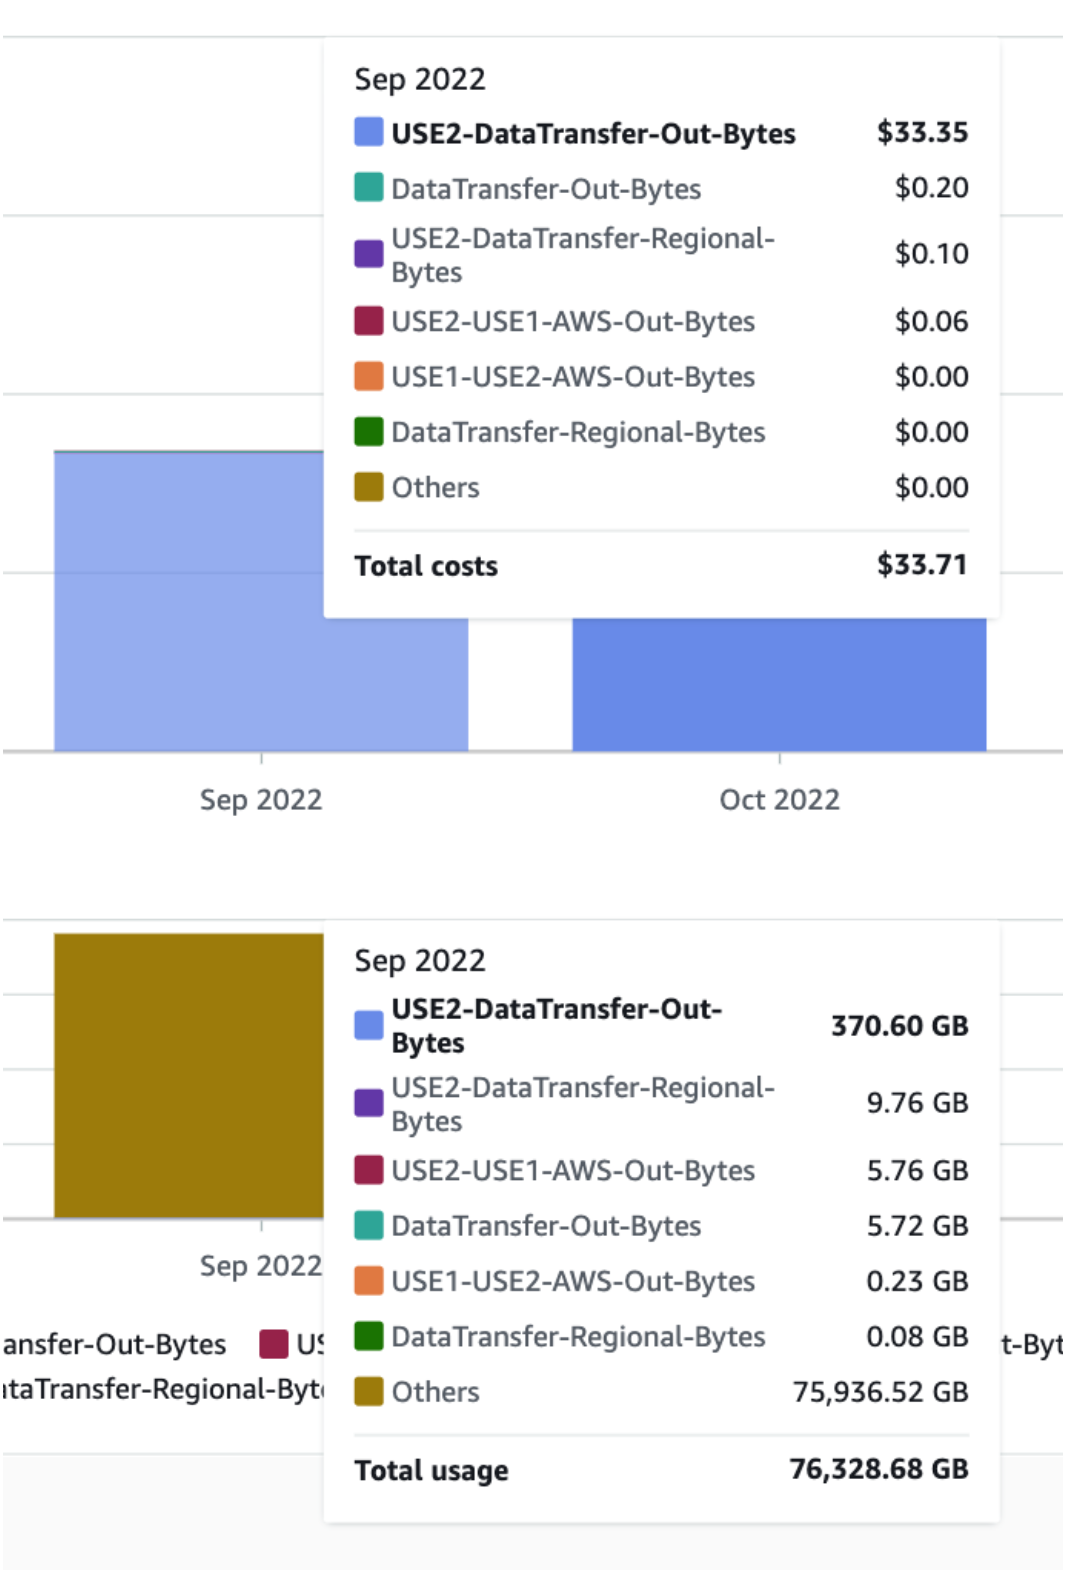
To see all of this traffic, broken down by type:
Group by |
Filters |
|---|---|
Usage type |
Service: EC2-Instances and EC2 - Other |
See this in your own AWS account: EC2 traffic breakdown (by month, July–December 2022)
As you can see, there’s lots of “Other” traffic that didn’t cost anything. Presumably this is traffic to your EC2 instances, which is free:
If you want to see just one type of traffic, you can be more specific in the Usage type group filter. For example, here’s cost and usage for traffic between zones:
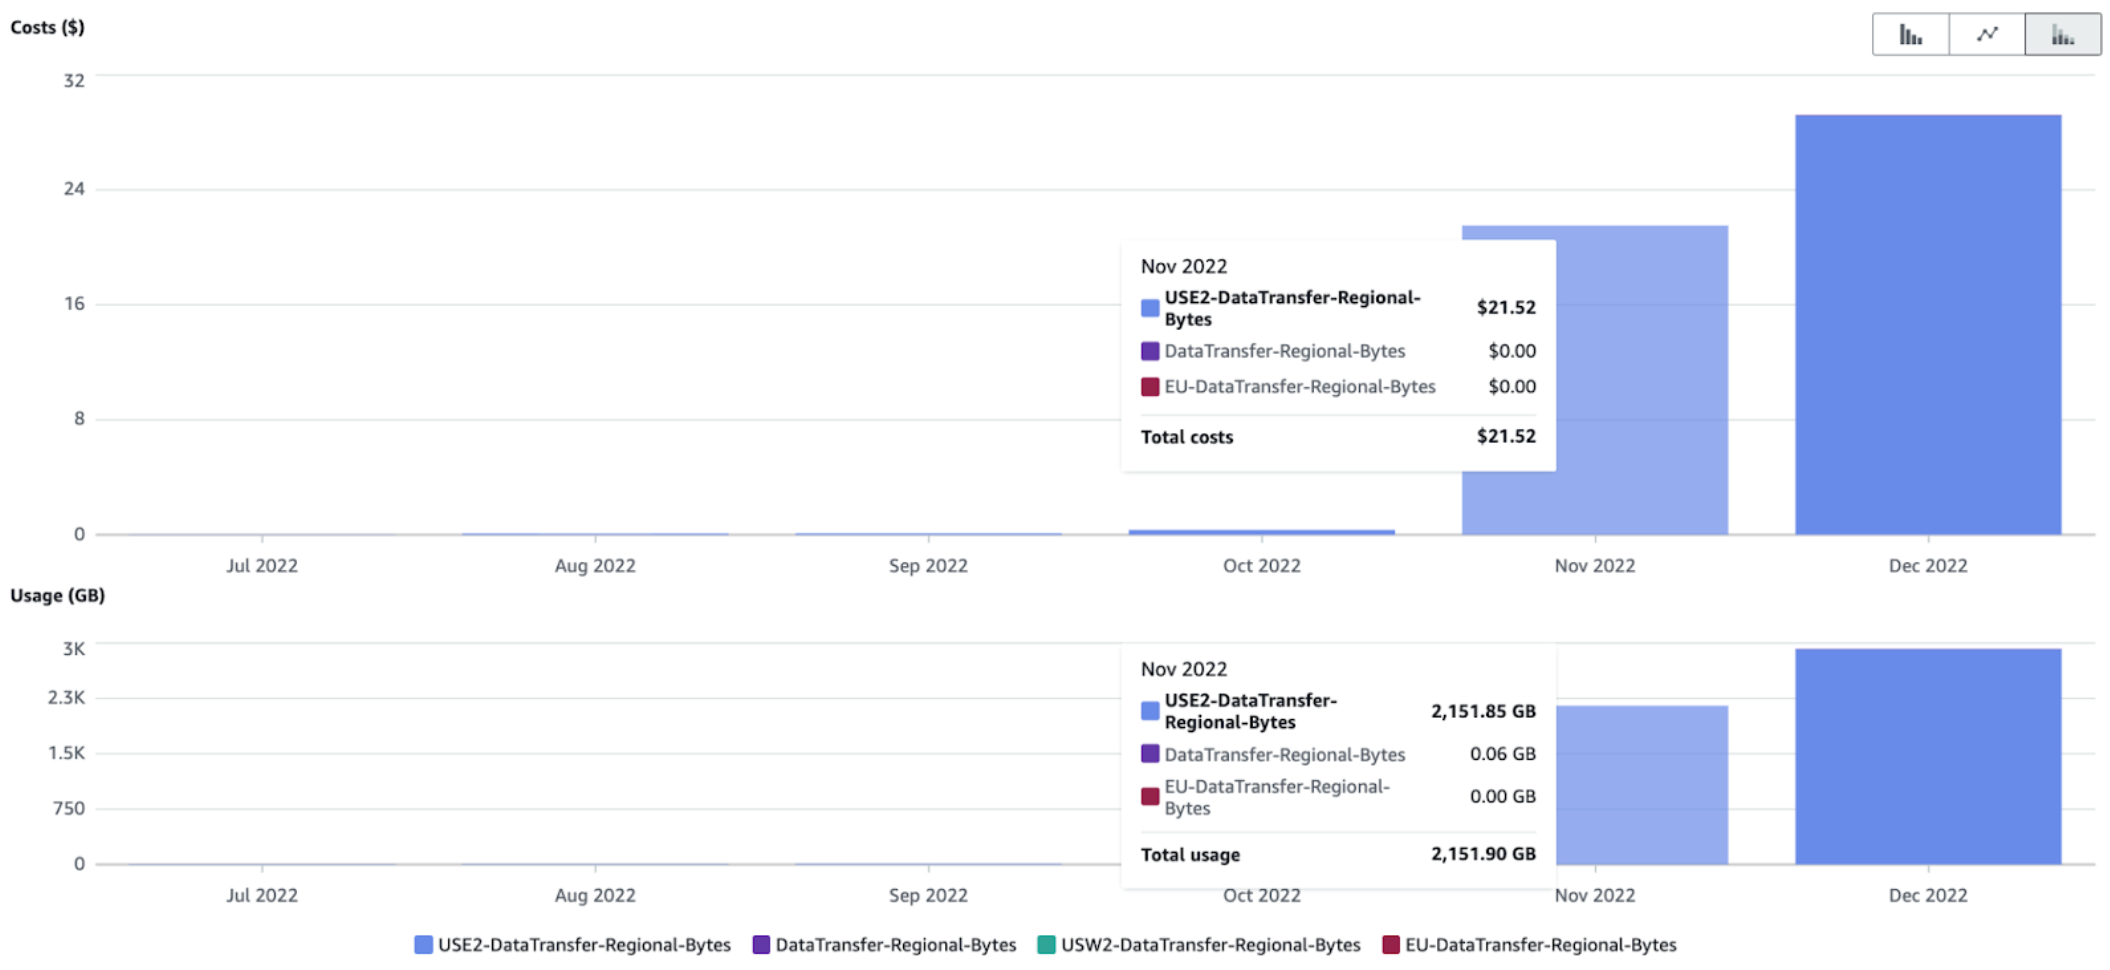
See this in your own AWS account: Interzone traffic (by month, July–December 2022)
Cost savings tip: We’re running distributed Python computations at scale and for some workloads there’s lots of data moved between compute nodes. For a while we experimented with clusters that were in multiple availability zones. As you can see, this was expensive. We now make sure that all the instances for a cluster are in the same zone.
NAT Gateways#
We don’t use NAT Gateways for our compute clusters, but we do use them for our control-plane infrastructure.
NAT Gateways have a fixed hourly cost and a per GB traffic cost.
You can see both together like this:
Group by |
Filters |
|---|---|
Usage type |
Service: EC2 - Other |
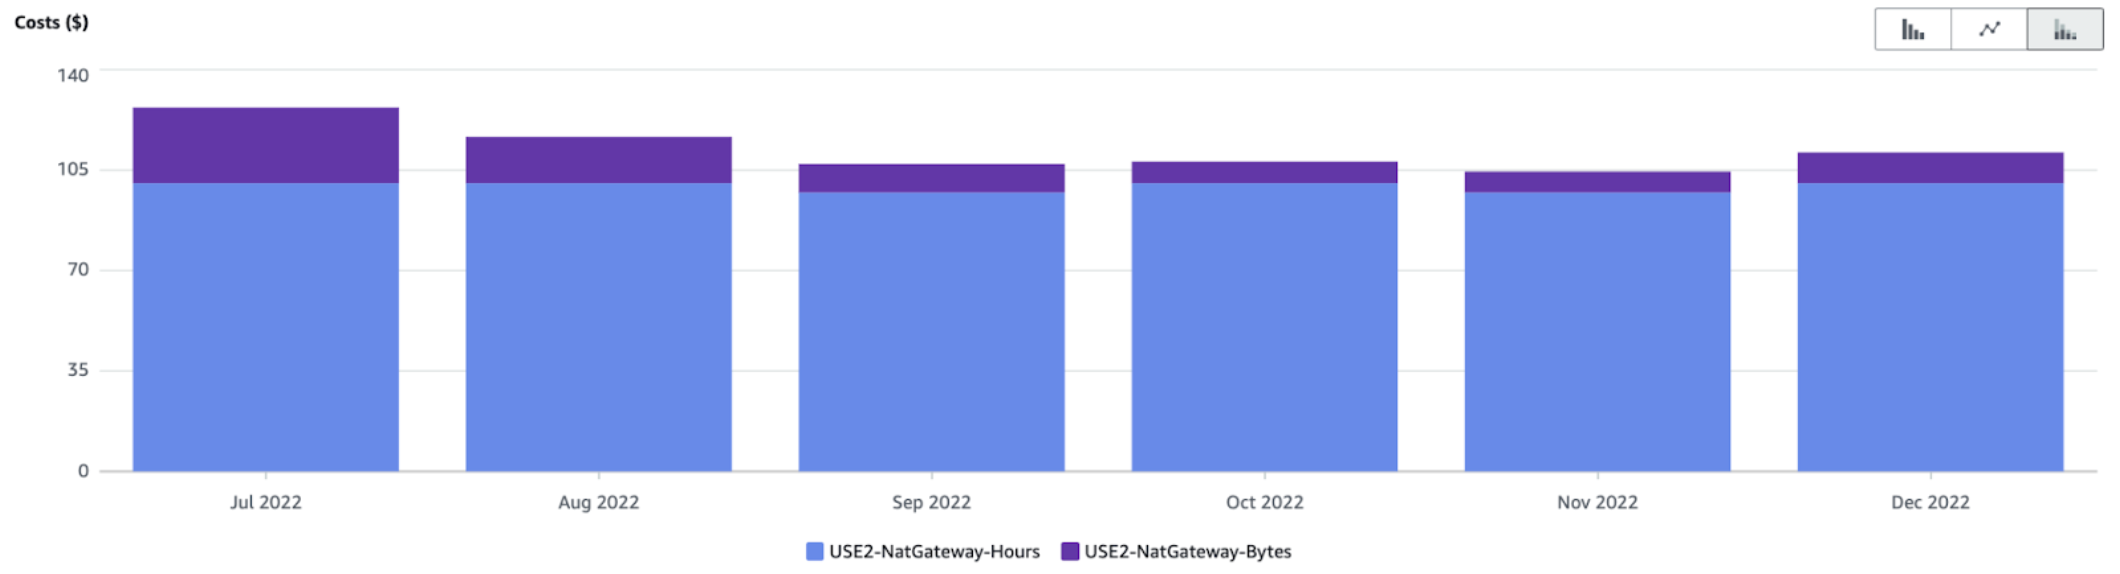
See this in your own AWS account: NAT Gateway total cost
If you restrict the usage type group filter to just “EC2: NAT Gateway - Data Processed”, you’ll get both cost and GB usage:
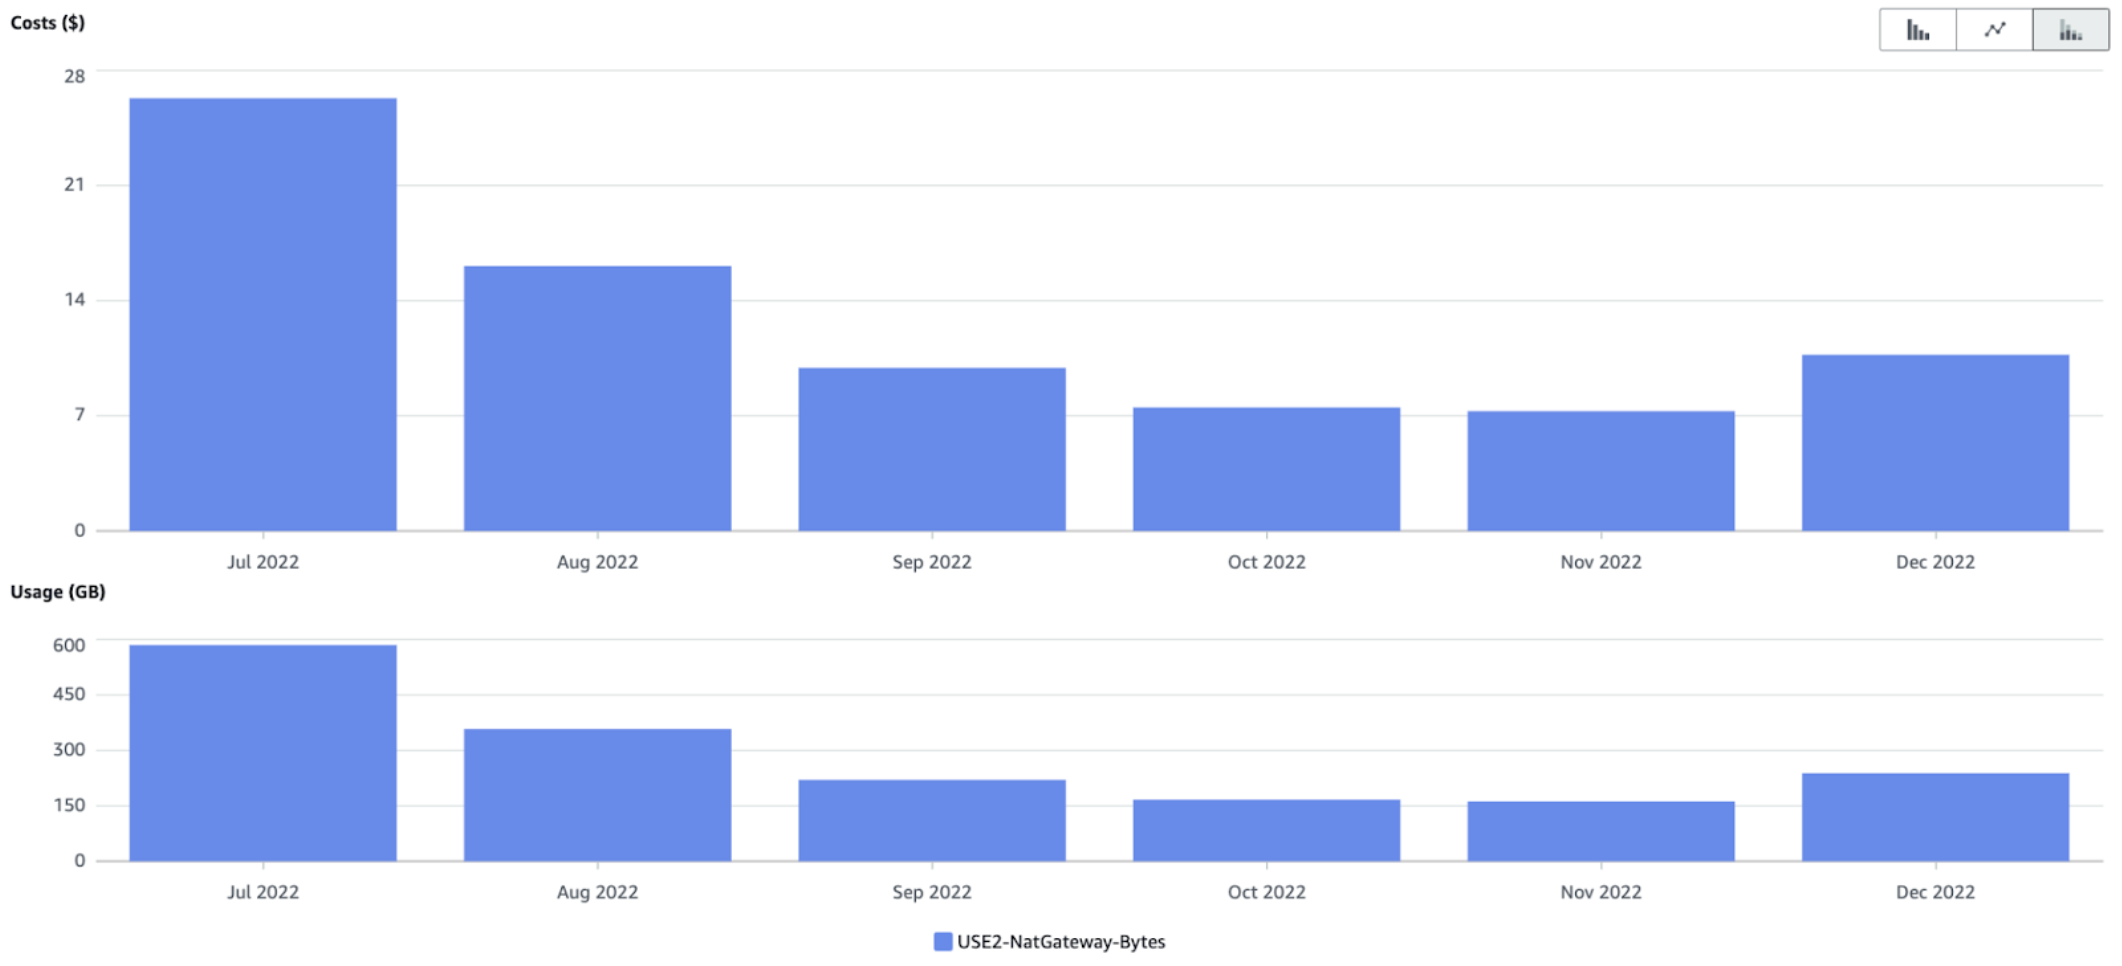
See this in your own AWS account: NAT Gateway data transfer
Cost savings tip: If you can, avoid using NAT Gateways. For our compute clusters, we use public IP addresses (for outbound connections) and then use security groups to block inbound connections to the workers (we only want inbound connections to the scheduler node).
Other costs#
There’s a good chance you’ll have costs for other services associated with your workloads. In our case, we have
S3 storage costs (transfer costs are minimal because we keep our EC2 instances in the same region as the relevant S3 buckets)
ECR storage and transfer (we build container images with our code and store these images in ECR)
CloudWatch logs (usually very low cost)
The best way to discover additional costs in your own account is by disabling all filters and grouping by “Service”. When there’s a service with a non-trivial (or higher than expected cost), I’ll usually dig in by filtering to that service and then grouping by various dimensions: region, usage type, maybe even by resource or by any tags that we use to distinguish costs for different projects.
Cost Explorer Links#
Use these views to start your own cost exploration.
Log in to the AWS Console, and if you use AWS roles, switch to the role associated with the account you want to explore. The links below should then take you directly to Cost Explorer with the filters and grouping already selected for you.
Once the view is loaded, you can change the date range, add filters (to, e.g., look at a specific region), see hourly or daily costs, or try other ways of grouping the data.