Jan 31, 2024
5m read
Real-world Grocery Demand Forecasting#
Every day, grocers are tasked with predicting the future: they have to predict how many items will sell in the future to order the correct amount of inventory today.
Since grocery retailers sell fresh food, which expires within a few days of being on the shelf, grocers need to be hyper-accurate in predicting item-level demand for each day.
If grocers over-predict, they have tons of unsold food that gets thrown out; today, if food waste was a country it would be the third largest emitter behind the US and China. On the other hand, if grocers under-predict, they’re left with empty shelves, which leads to immediate revenue loss but also long-term a drop in customer loyalty.
Parallel Time Series Forecasting in Python#
Fortunately, we can use machine learning algorithms with large, real-world datasets to make SKU-level predictions with greater accuracy and efficiency. In this article, we’ll discuss how we’re using models like XGBoost with Dask and Coiled for time series forecasting with large datasets in Python.
XGBoost (Extreme Gradient Boosting) is a powerful machine learning algorithm that uses an ensemble learning method combining multiple decision trees to make predictions. Dask is a general purpose library for parallel computing. Dask is tightly integrated with XGBoost, which makes it easy to train models at scale and run predictions on large datasets. With Coiled, we can easily run Dask in the cloud.
Challenges of Traditional Forecasting Methods#
The standard solution to demand forecasting is to use historical sales data to predict future demand. These traditional forecasting methods based exclusively on historical sales data have several limitations.

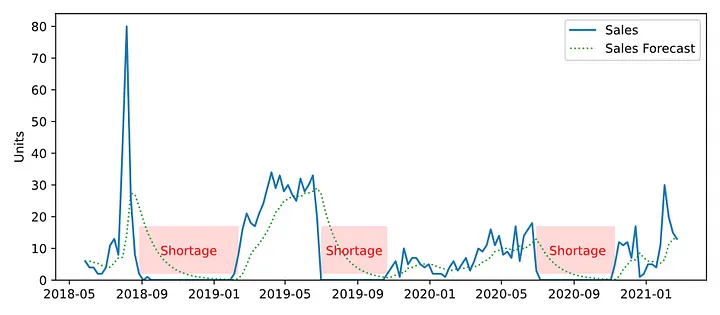
Inaccurate forecasts lead to both excess inventory and shortages. Image from Nicolas Vandeput’s blog post.#
Inability to Adapt to Real World Events#
Standard time series forecasting relies on using historical data to make predictions. But history doesn’t always repeat itself.
On one hand, trends change over time as macro factors like economic conditions change. On the other hand, specific events spring up that forecasting models have no knowledge of - things like major sports games, one-off concerts or conferences, or even just school term dates.
So, to forecast accurately, models need knowledge of what’s happening in the real world.
Is it going to be unseasonably warm tomorrow? Did school start back up and kids need snacks? Did a promotion on substitute products just end? Are the 49ers playing down the road from the local store? There are hundreds of real world factors behind a shopper’s every single purchase.
Time-Consuming and Prone to Human Error#
Forecasting models that are unable to account for real-world events (like holidays or promotions) require manual, ad-hoc adjustments. These adjustments not only require a lot of effort, but are also prone to human mistakes.
That’s especially true given how much interplay there is between demand drivers. Maybe this year’s 4th of July celebrations will be small because of the bad weather and local road closures.
Limited by Data Size and Complexity#
Traditional forecasting methods like regression models are not designed to handle large and complex datasets and multivariate problems. As a result, they may not be able to capture all the relevant factors that influence demand, leading to less accurate predictions.
Real-World Example: Grocery Demand Forecasting#
The problem of bad forecasting is especially acute in grocery. The spikiness that we see in the charts above has a large effect. It’s the difference between having empty shelves in the guacamole section on the SuperBowl, or stocking and wasting too much guacamole during the rest of the year.
Fortunately, the world is full of data, and we can use that data to get really well-informed models:
Sporting events
Good: calendar of events, joined with proximity to local stadiums
Better: sports betting odds and activities on each game so we know when the stadium will be empty or full
Concerts:
Good: Find out when concerts are in town
Better: And cross-reference Spotify data to see how popular the artists are to predict attendance
Ethnic holidays
Good: a calendar of which days are public holidays
Better: a calendar of holidays for every ethnic group, combined with demographic information about the surrounding neighborhood
At Guac we specialize in customizing algorithms with hyperlocal data for our different grocery customers.
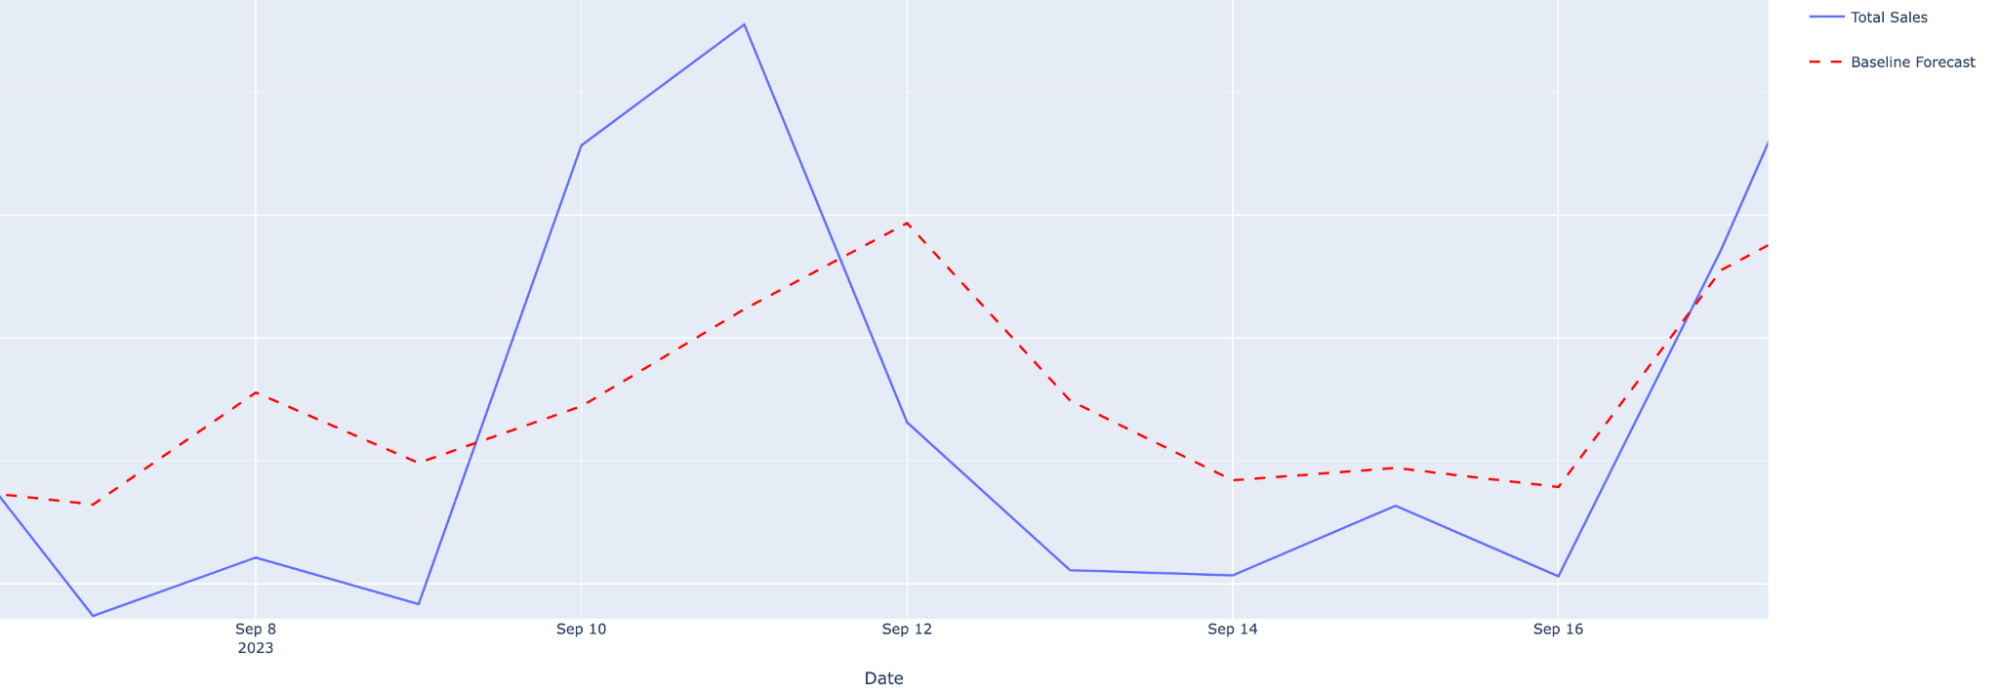
Take the following example of a real 2023 sales graph from one of our customers. Running a standard historics-based approach to forecasting, the model totally misses the increase in demand driven by a big 49ers vs. Steelers game on the weekend of 10 September.

Actual (blue) and predicted (red) grocery sales before including data on sporting events.#
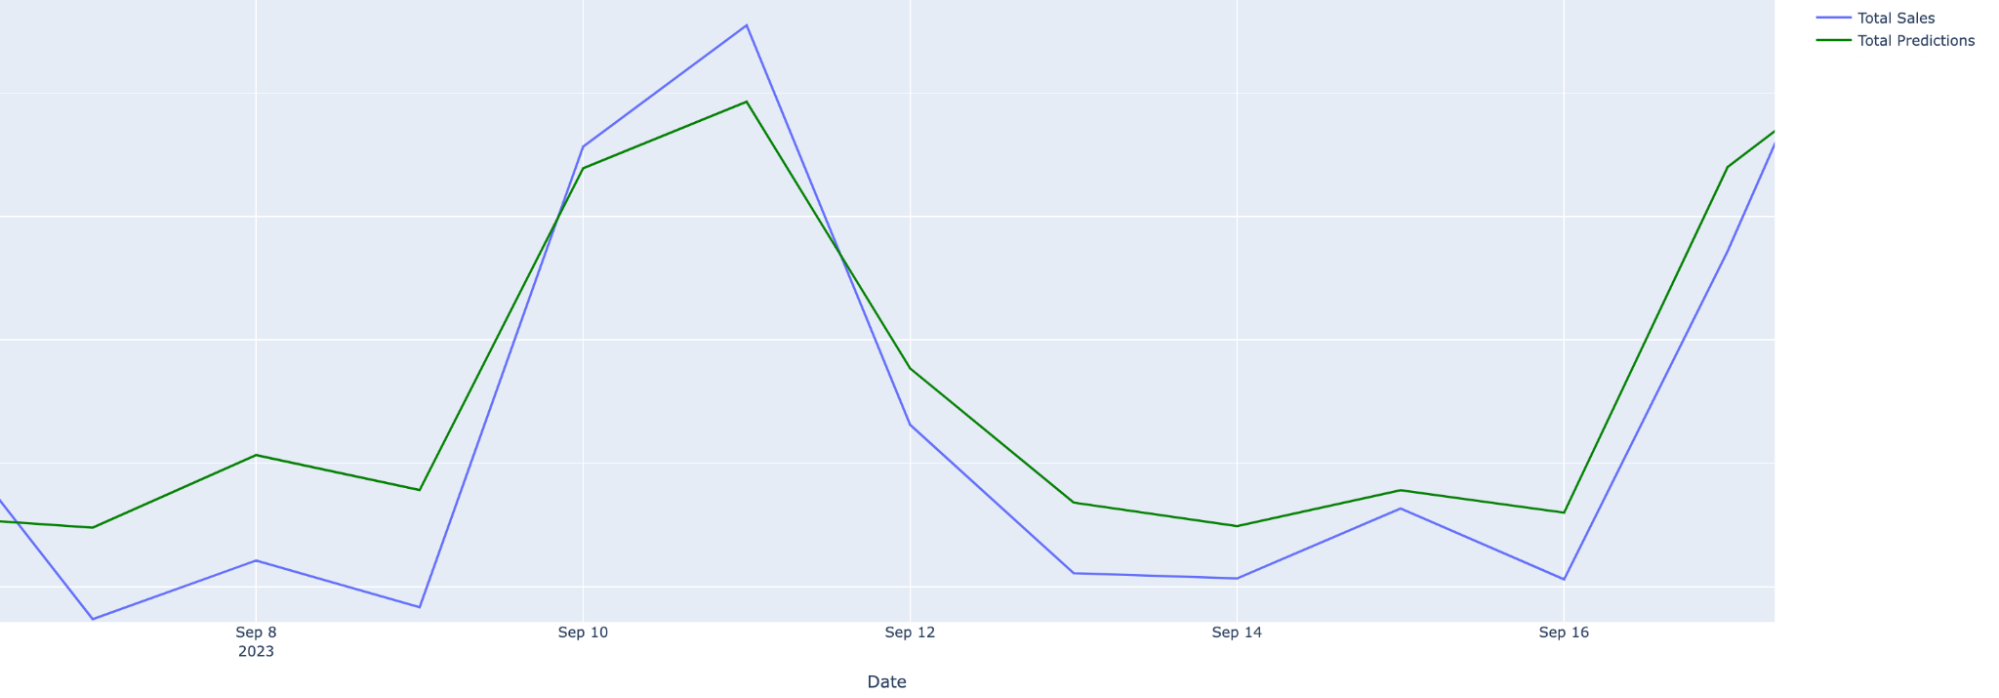
But once we enriched the data with information about the game and its expected popularity, we can almost perfectly capture the true sales on the day.

Actual (blue) and predicted (green) grocery sales after augmenting the dataset with hyperlocal data. Accounting for the popularity of the 49ers vs. Steelers game provided much more accurate predictions.#
Distributed XGBoost for Large Tabular Datasets#
Unfortunately, adding all of those extra features greatly increases the size of our data. For one of our customers, this meant a 15x increase in the size of the dataset from 5 GB to 75 GB.
Setting up this infrastructure was a bit daunting. We considered using Spark and Databricks, but that would have required rewriting a huge amount of our pandas-heavy codebase. We instead latched onto Dask and Coiled.
Dask was great because …
It was almost a drop-in replacement for our existing pandas code
It had great integration with a wide range of ML libraries, such as XGBoost
Coiled was great because …
It handled all the messy dev-ops work for us
Setup was super fast and we had our Dask clusters up and running in under a day
Support has been really helpful, working with us on migrating our codebase and infrastructure
Conclusion#
If this kind of rich real-world demand forecasting is something that you could use, then talk to us at Guac. We invite you to try it out with a trial on your past sales data, showcasing its ability to cut food waste.
If you’re looking for super-easy distributed XGBoost, look no further than Coiled. It’s easy to get started and free for modest use.