Coiled observability wins: Chunksize#
Distributed computing is hard, distributed debugging is even harder. Dask tries to simplify this process as much as possible. Coiled adds additional observability features for your Dask clusters and processes them to help users understand their workflows better.
This series of posts will illustrate how we are building metrics that help us detect clusters that are underutilized or run into errors. We are using this information to help users with optimizing their workflows.
This post will illustrate how small chunks of data can slow your workflow down and lead to underutilizing your resources.
Coiled collect all metrics that we describe in these posts. We only use them to monitor the health of Dask clusters and to help users improve their Dask workflows. Coiled users can turn the metric collection off at any time without compromising their workflows.
Using bigger chunks to avoid bottlenecks on the scheduler#
Dask processes your data in chunks. Every chunk creates one task per operation on your data (we will ignore fusion of tasks for simplicity). The processing time per task grows with the size of your chunks. Finding the appropriate size for these chunks is not always trivial.
A common guideline for tasks within a Dask workflow is that tasks should run for at least 100ms. The scheduler has some overhead while figuring out how to schedule your workflow efficiently. Having tasks that run significantly faster would strain your scheduler.
Dask tries to optimize the default chunksize, but this might conflict with other parameters. One common example is many small input files. Dask generally parallelizes over your files to speed up the I/O step. This will result in small chunks in this case.
Let’s look at some of our observations from clusters that had tasks with a processing time significantly below that. We will create an example with synthetic data here.
import dask.array as da

arr = da.random.randint(1, 1_000_000, (3500, 3500, 3500), chunks=(50, 50, 50))
arr.mean().compute()
This example creates a random Dask array with tiny chunks. Processing one of these chunks takes only 2ms, which is very short for a Dask task. Let’s look at how our task stream looks while processing this query:
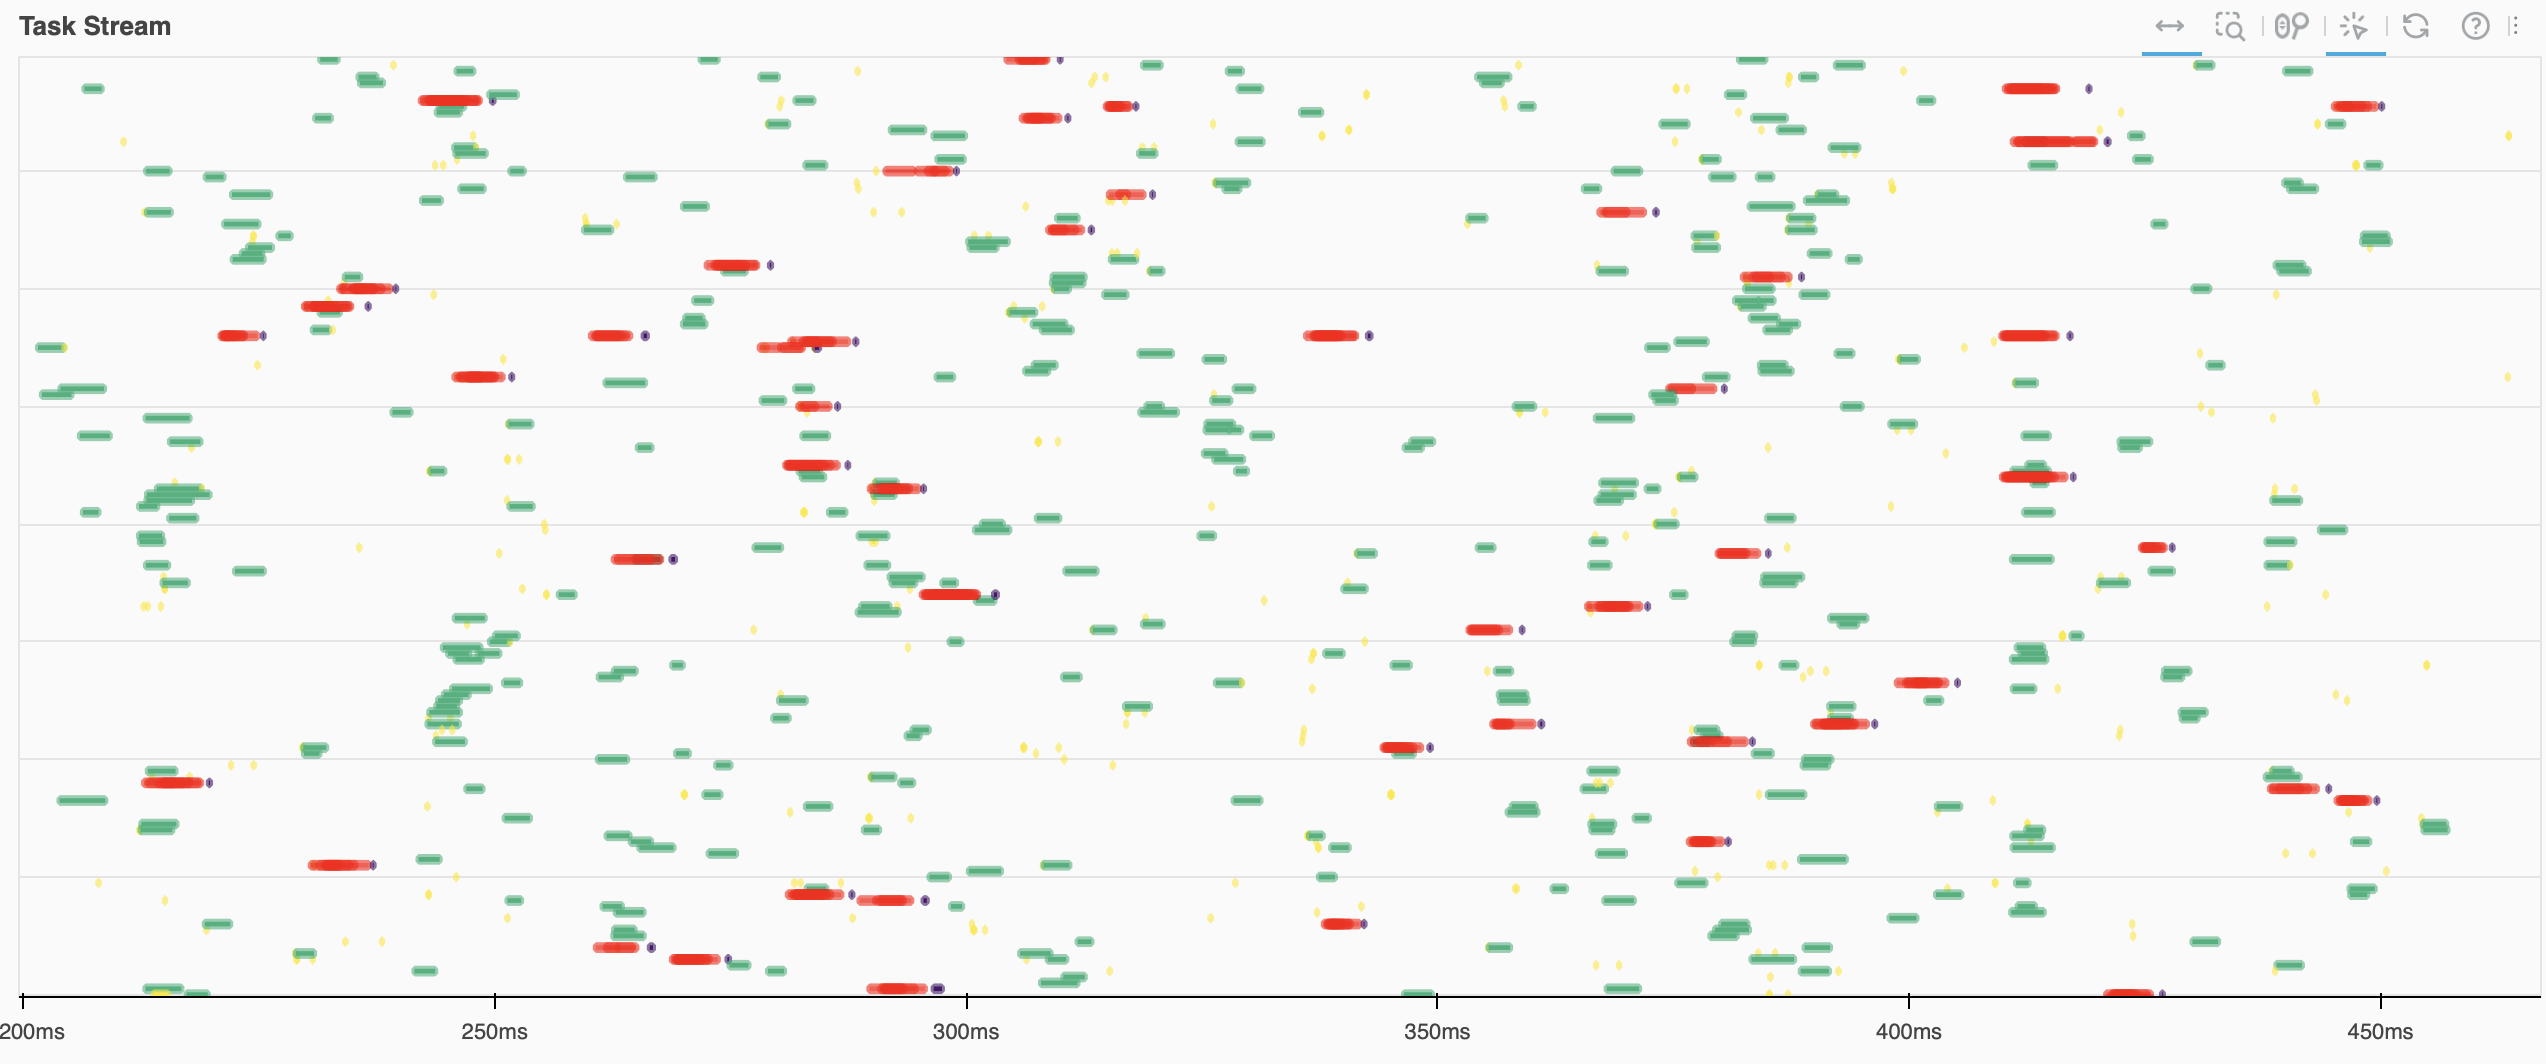
This is a snapshot from the Dask Dashboard. We can see that the task stream has many small dots and a lot of white in between. The white spots represent periods where your workers are idle because they don’t have anything to process. This is generally a sign that your resources aren’t used efficiently. This workflow is clearly constrained by the scheduler.
Automatically detecting these patterns with Coiled#
Coiled allows us to monitor clusters of our customers and to detect some of these patterns. This is a tool we use to help customers to run their code faster and use their resources more efficiently.
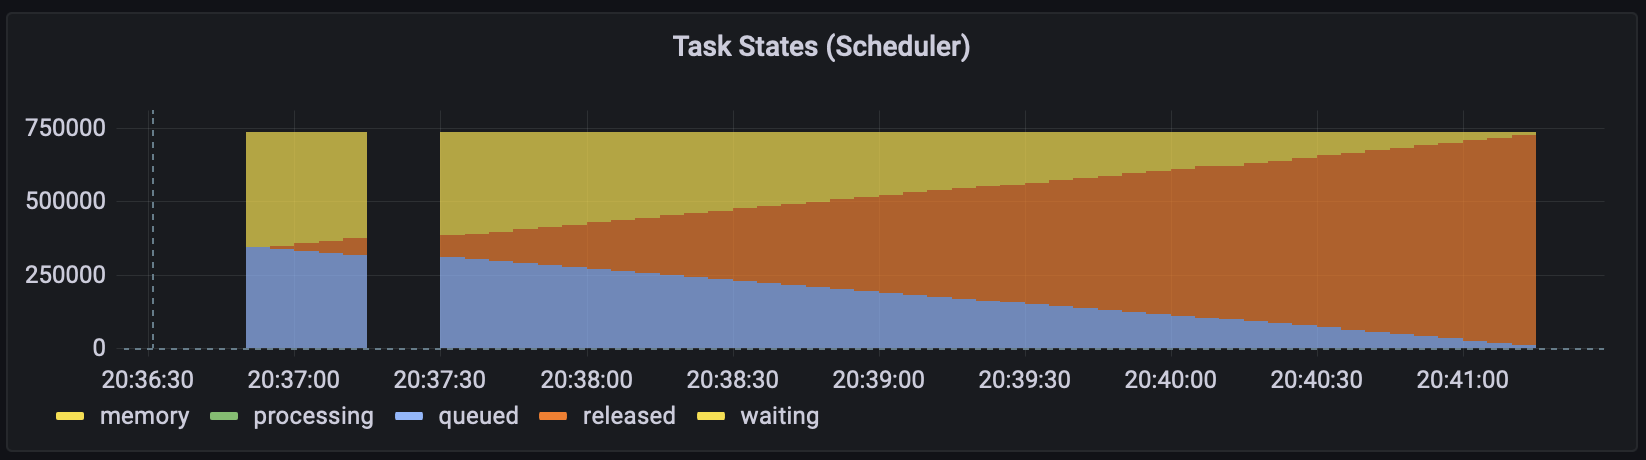
We have two metrics that allow us to spot these types of clusters automatically. The first collects the number of tasks on the scheduler that are queued. This metric notifies us when the number of tasks reaches a certain threshold.
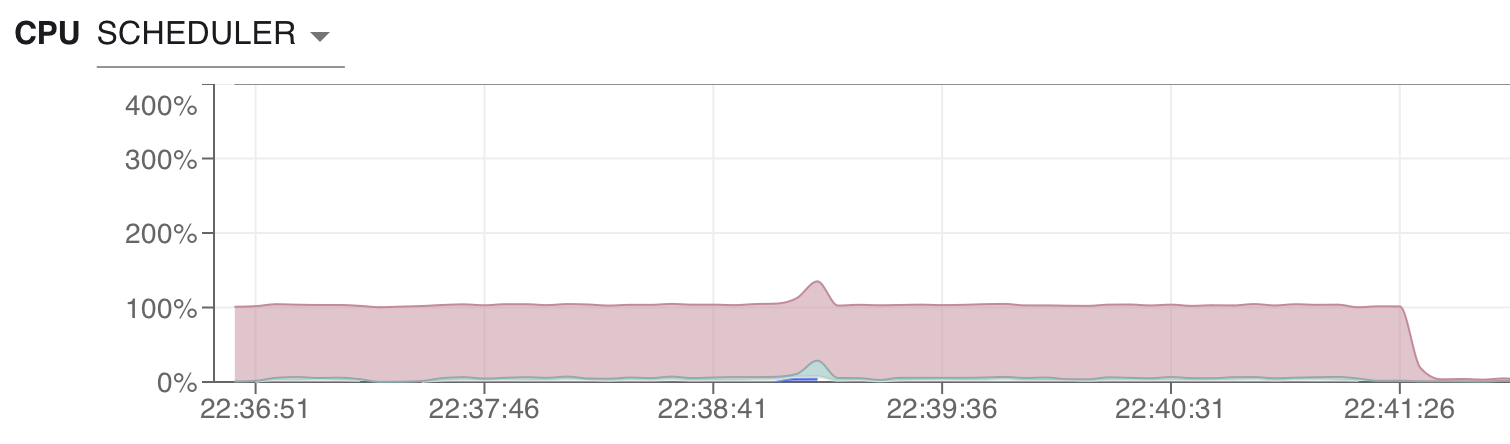
That is not a foolproof system, large task graphs can have a lot of tasks while using an efficient chunksize. We have another metric that checks CPU utilization on the scheduler periodically and flags clusters that have long periods of time when the scheduler uses close to 100% CPU. This is a sign that the scheduler constrains the workload on your cluster.
Again, this is not foolproof. There could be a number of reasons why scheduler utilization is so high. Using both metrics together enables us to flag these clusters with a high degree of certainty.
We will then reach out to our users if we detect this pattern on one of their clusters. One of our engineers will work with them to make their workload more efficient and thus run their workflow more efficiently.
In this scenario, we would recommend increasing the chunksize of the individual chunks.
import dask.array as da

arr = da.random.randint(1, 1_000_000, (3500, 3500, 3500), chunks=(400, 400, 400))
arr.mean().compute()
This now runs in a couple seconds, rather than minutes.
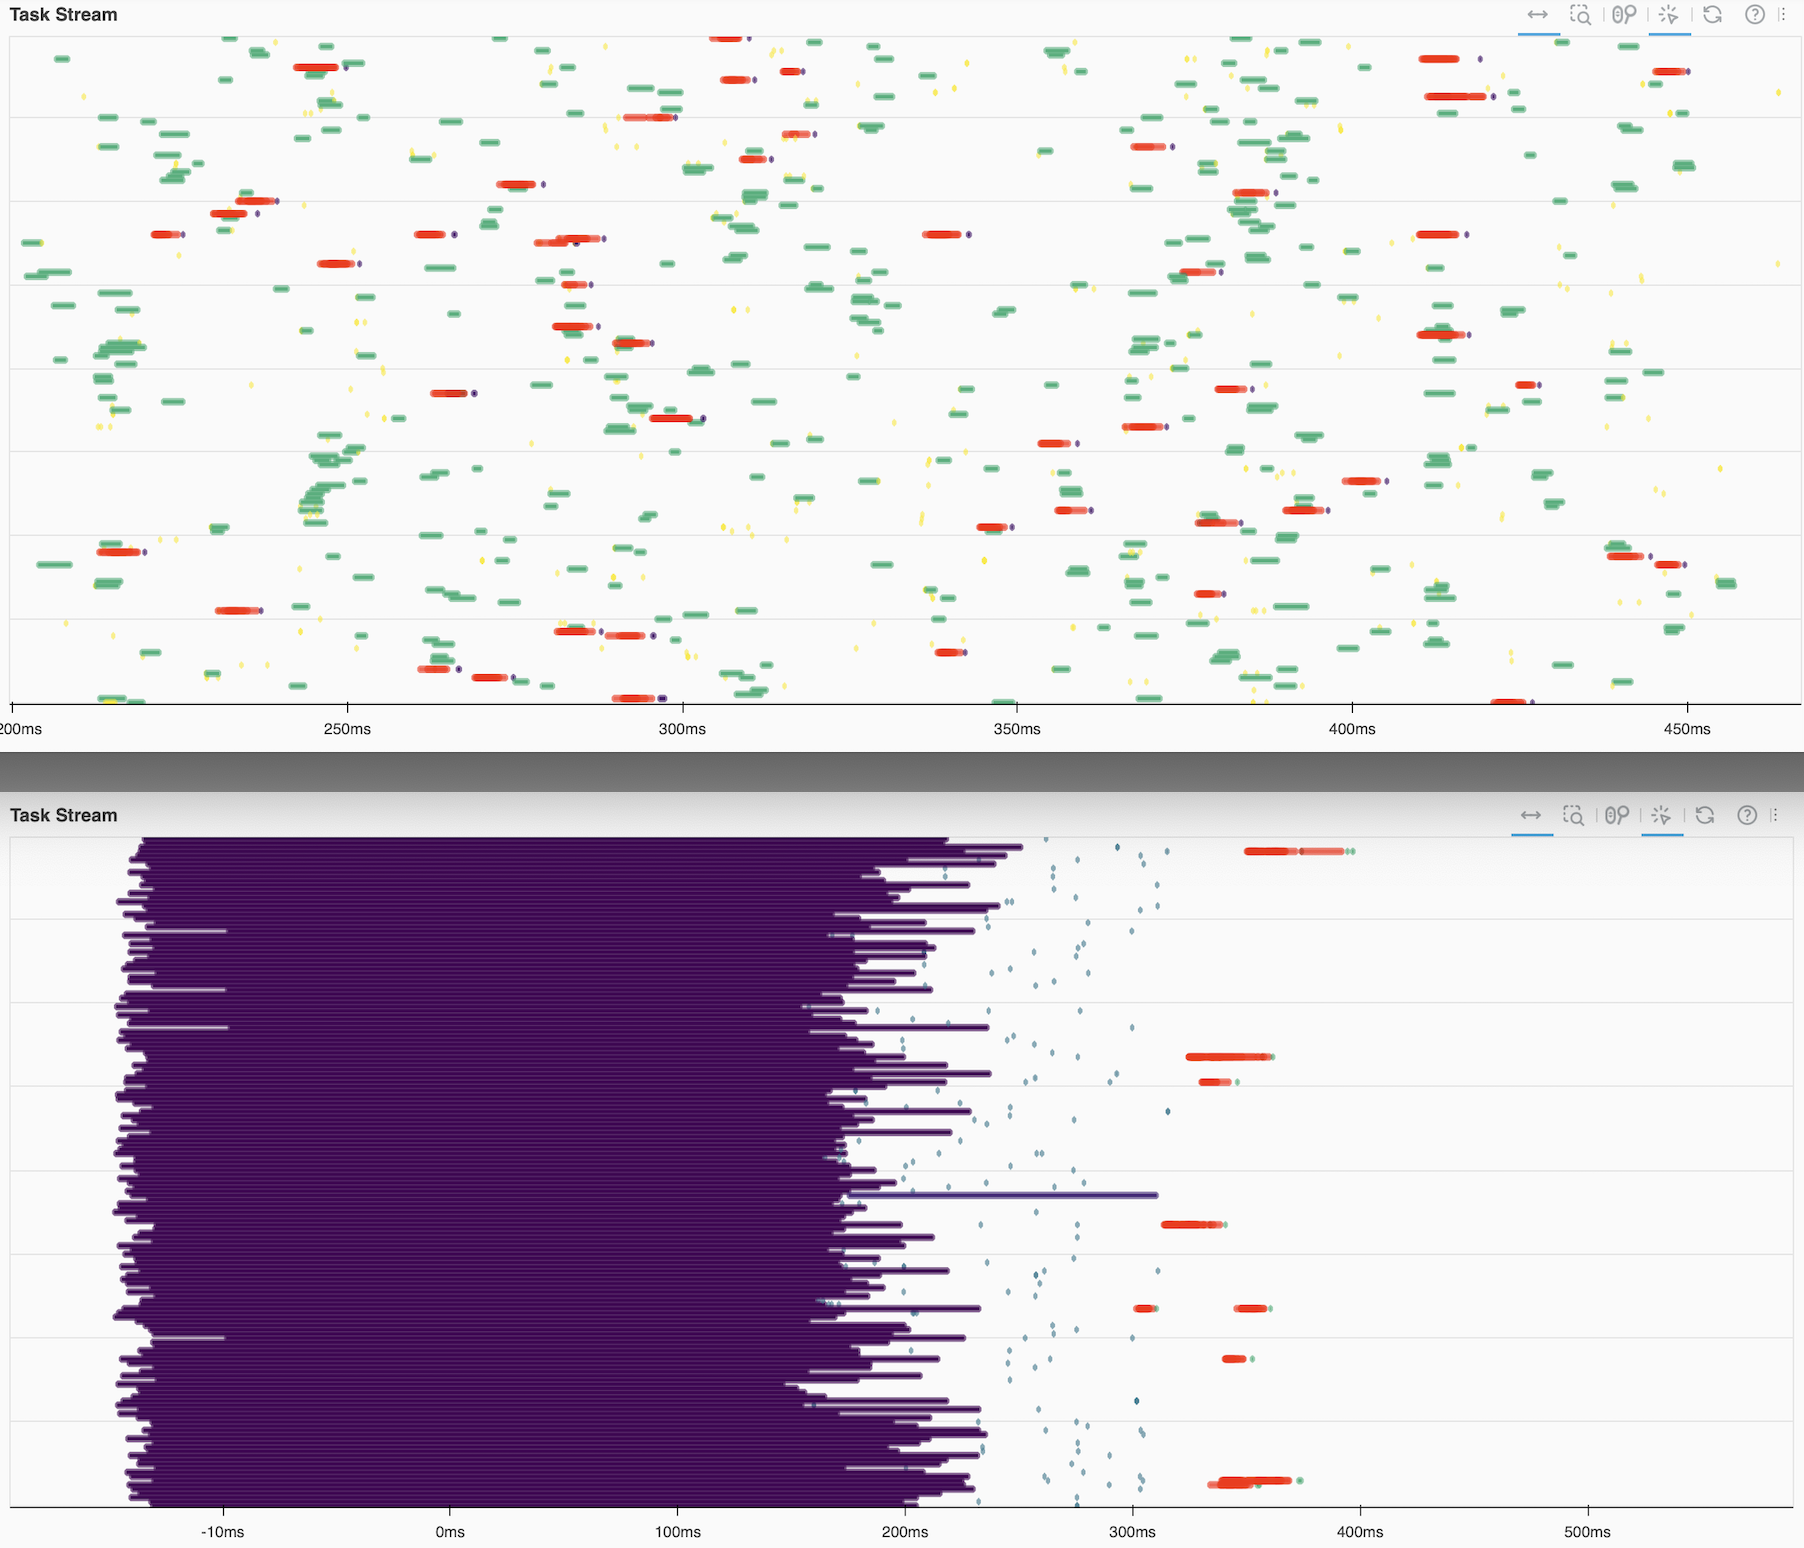
The scheduler is also pretty bored while processing our query. That’s exactly what we were aiming for.
Conclusion#
Coiled offers us a lot of insights into Dask clusters and their metrics. We can use this to identify clusters that aren’t used as efficiently as possible. Having relatively small chunksizes can lead to underutilizing your resources and thus spend more time than necessary on a give computation.
Monitoring the number of queued tasks and scheduler CPU allows us to detect such clusters automatically and help users adjust their code to make better use of their hardware.