Performance testing at Coiled#
At Coiled we develop Dask and automatically deploy it to large clusters of cloud workers (sometimes 1000+ EC2 instances at once!). In order to avoid surprises when we publish a new release, Dask needs to be covered by a comprehensive battery of tests — both for functionality and performance.
Functional regression testing#
Dask is thoroughly covered by functional unit tests which verify that, when you feed certain inputs into the system, you obtain the expected outputs. Similarly to most software development projects nowadays, we use a CI-assisted, automated workflow for it:
A developer opens a PR;
The PR code is automatically executed in CI against all functional regression tests;
If, and only if, all tests are green the PR can be merged into main.
The key features of this system are:
It re-runs on every change;
Nobody needs to explicitly remember to start the tests;
It runs in a stable, reproducible environment;
It re-tests everything, not just what the developers think may be impacted.
None of the above should surprise anyone these days. What we do, that is definitely more out of the ordinary, is we apply the exact same paradigms commonly used for functional regression testing also to performance testing.
What we did in the past#
Historically, whenever we had to decide whether to merge a Dask PR with a likely performance impact, we ran ad hoc manual tests on one or two use cases that we thought would be relevant, which we found was not sustainable:
It was labor-intensive, as the developers would need to rebuild the use case and manually meter it every time;
PRs frequently impacted unexpected use cases: a PR that would produce a speed-up where expected sometimes caused a regression where nobody was looking;
A cluster with hundreds of workers very rarely exhibits deterministic performance; if you run the same test twice there will be some variance in the measured metrics. One-off manual tests tend to ignore variance and instead take the first measure as golden.
Clearly something had to change.
What about ASV?#
Airspeed Velocity (ASV) is a great microbenchmarking tool. Emphasis however should be put on the micro bit in the name, as there are important limitations:
Everything must run on a single box;
You must trust performance to scale linearly;
You are only interested in end-to-end runtime.
When testing Dask:
Performance on a LocalCluster is completely different from that on AWS. Network latency and bandwidth play a major role, as do other bottlenecks such as I/O throughput. You can’t expect the behaviour of a single box to be representative of a cloud cluster, even with the same amount of CPUs and RAM.
You can’t expect a scaled down problem running on 4 CPUs to be representative of a production size problem running on 400 CPUs. Again, bottlenecks such as the scheduler, S3 throughput, and network bandwidth play a fundamental part in this.
There are many metrics other than end-to-end runtime such as memory and network usage, as well as the breakdown of the totals.
coiled/benchmarks#
We created a GitHub repository and wrote a comprehensive suite of tests in it. Each test spawns a medium-sized Coiled cluster and runs a realistic use case, such as:
Each test case is measured on selected performance metrics; at the moment, end-to-end runtime, peak memory usage, and mean memory usage; we plan to add more in the future.
The test suite runs in two modes: nightly regression tests and A/B tests.
Nightly tests#
Every night, CI will automatically:
Run all tests;
Detect regressions in test runtimes;
Open a GitHub issue if performance degrades from previous days;
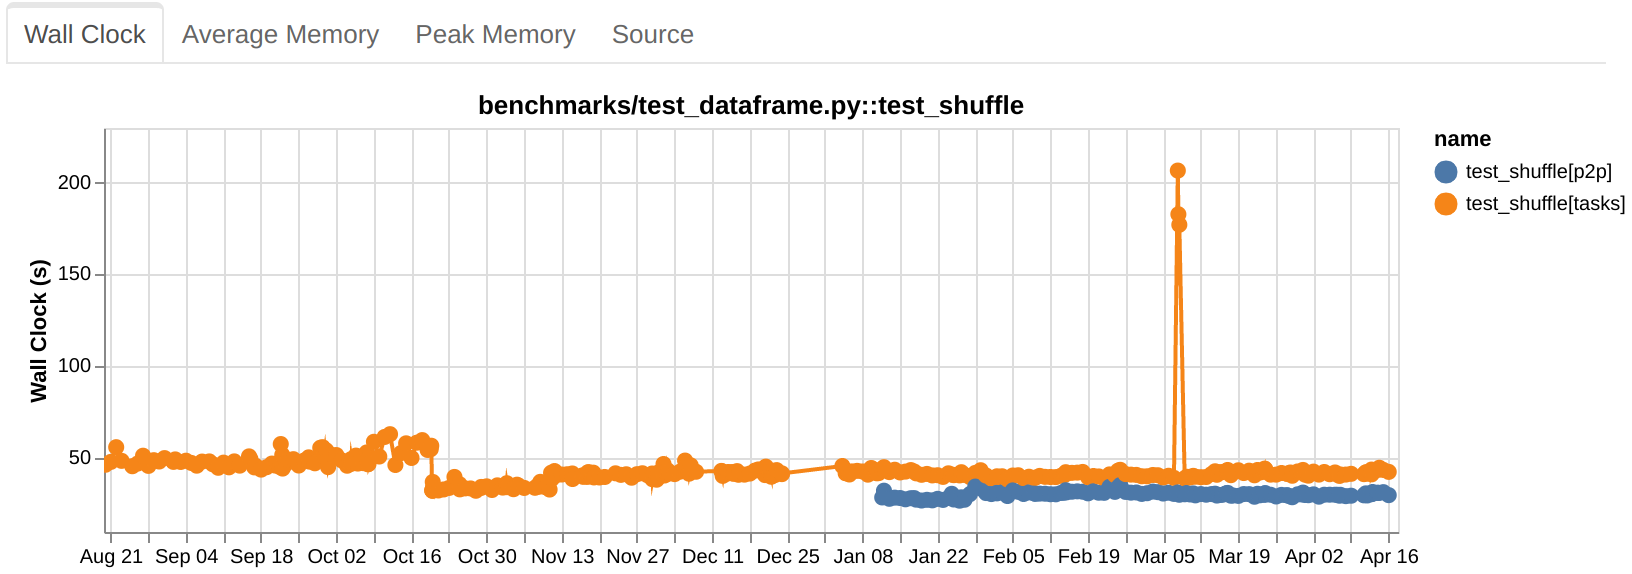
Publish a report showing several months worth of results.
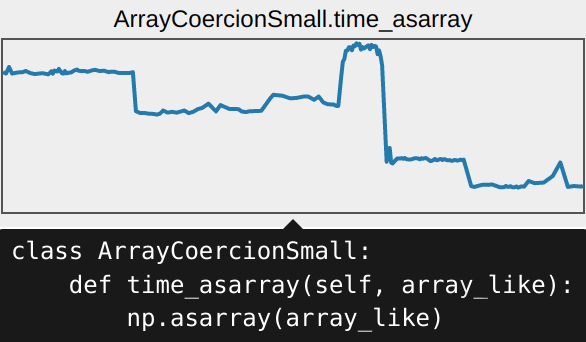
Case study
The test shown in the above image exhibited a very consistent end-to-end runtime throughout the months. Then, one fateful day in early March, somebody merged a PR into main that caused this test to slow down by a factor of 4x!
The next morning Dask maintainers woke up to a new GitHub issue highlighting the regression. The issue was promptly investigated and remediated shortly thereafter.
A/B tests#
Before we merge major PRs we push to the coiled/benchmarks CI two or more conda environments:
A (a.k.a. baseline; what we know and love)
depedencies:
  ...
  - dask ==2023.4.1
  - distributed ==2023.4.1
B (a PR, the next release, whatever)
dependencies:
  ... # Everything same as baseline
  - pip:
    - git+https://github.com/dask/dask@b85bf5be72b02342222c8a0452596539fce19bce
    - git+https://github.com/dask/distributed@6dc4c24b7a01b93952bbfd95d3ecba043580c245
The conda environment files can be accompanied by Dask config files and/or parameters to the Coiled cluster; this allows, for example, to test how switching on/off work stealing affects performance or how 10 workers with 4 CPUs each compare against 20 workers with 2 CPUs each.
You can also increase cluster size on the fly; most test data scales dynamically with cluster size so that end-to-end runtime remains roughly constant:
# For all tests using the small_client fixture
small_cluster:
  n_workers: 10
  worker_vm_types: [m6i.large]  # 2 CPU, 8 GiB
def test_dot_product(small_client):
    memory = cluster_memory(small_client)  # Typically 76.66 GiB
    shape = scaled_array_shape_quadratic(memory // 17, "4.5 GiB", ("x", "x"))
    a = da.random.random(shape)
    b = (a @ a.T).sum()
    b.compute()
Once the test settings are uploaded CI will run all tests, multiple times, in the A and B configurations and will generate a statistical analysis of the differences.
Confidence report#
This A/B report shows, for every test case, how likely it is that B is better/worse than A in end-to-end runtime, memory usage, etc. This is an aggregation of 5+ runs for B vs. 5+ runs for A; the report shows p values as transparency:
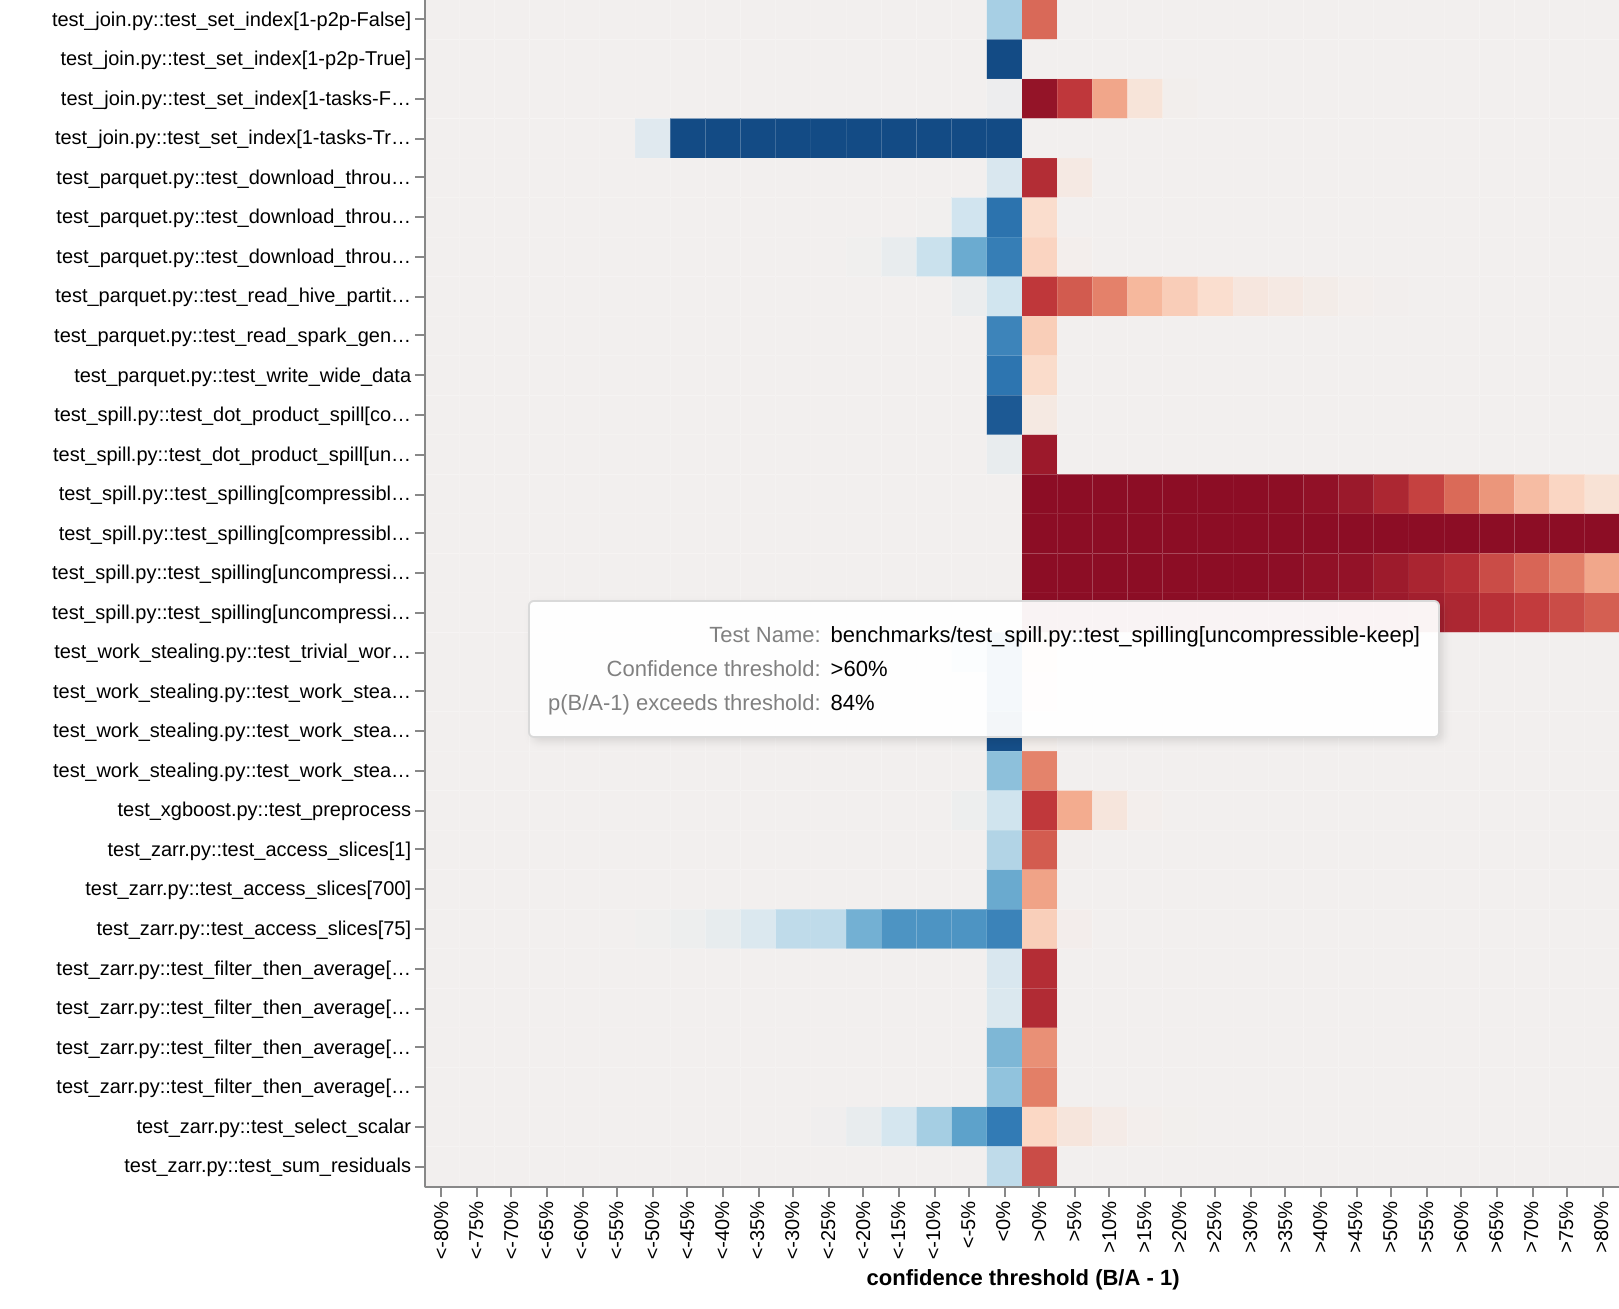
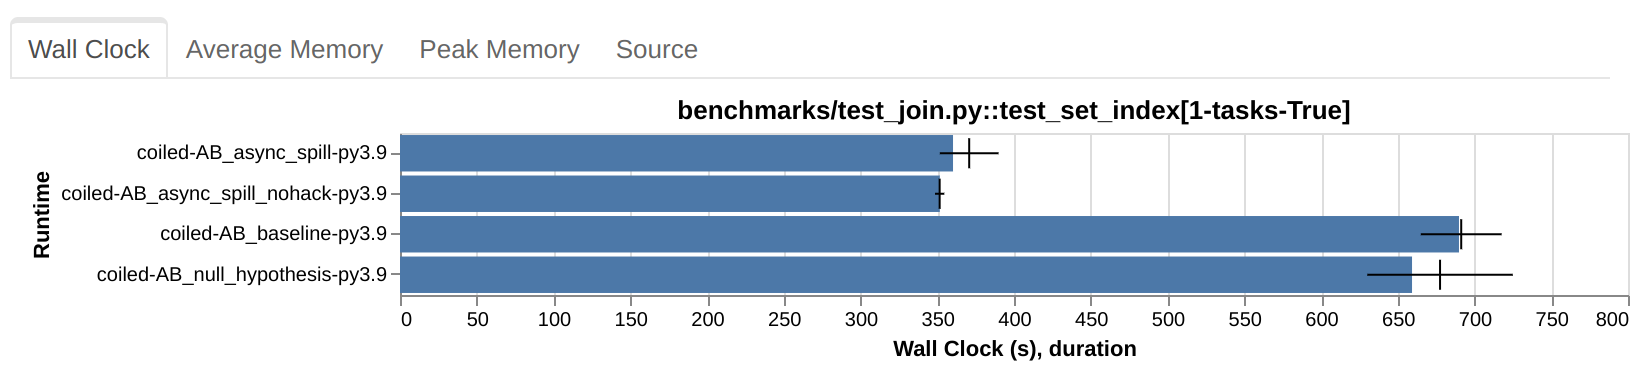
Case study
The above plot is the output of a preliminary performance test for a PR introducing
Asynchronous disk
access. The PR
caused test_set_index (4th row from the top) to become at least 40% faster (p=95%) and
test_spilling (middle of the plot) to become at least 60% slower (p=84%).
Both results were completely unexpected; the PR did not get merged.
Null hypothesis#
Some tests are noisier than others. CI automatically runs tests for the baseline environment twice and compares them in A/B. If the null hypothesis shows changes, then information from that test should be treated as noise in the actual A/B tests.
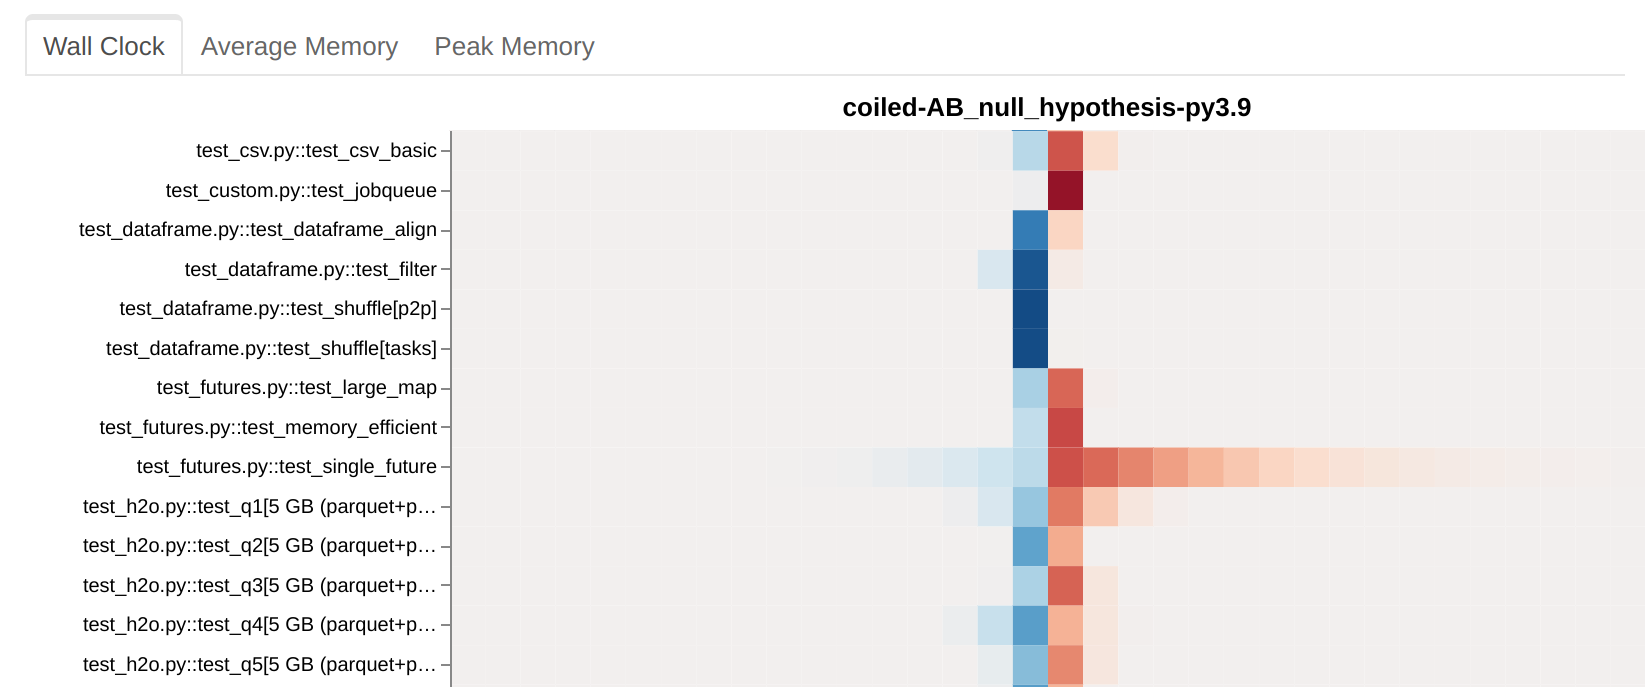
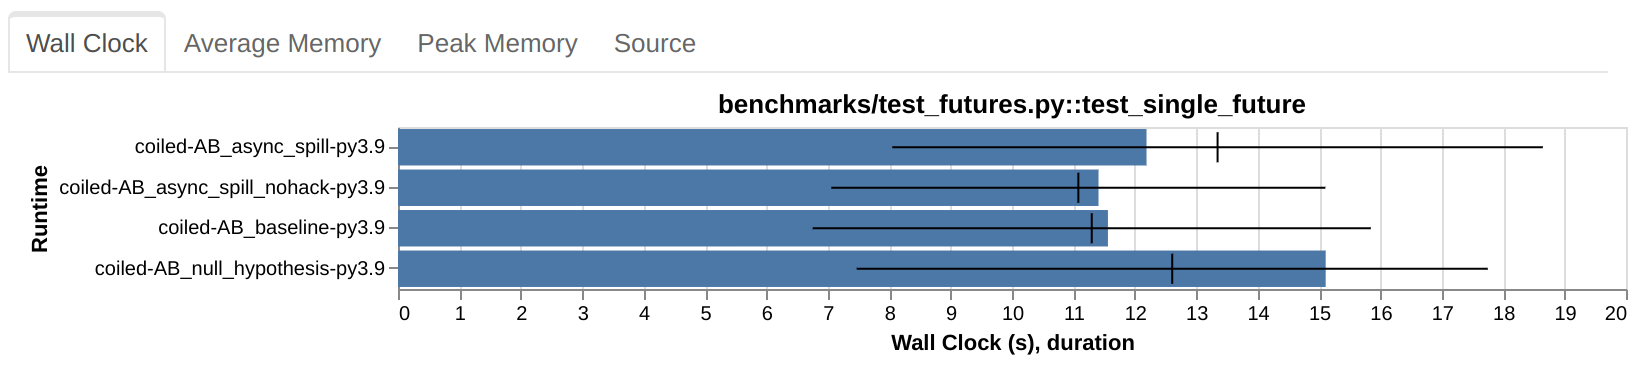
Case study
In the above plot, test_single_future seems to be sometimes a bit faster, sometimes a
bit slower in the B setup compared to A. Except that A and B are identical. This is
because the test is so noisy that, out of sheer luck, the runs in B were faster on
average than those in A. The test should be ignored when looking at actual A/B
situations. If you want meaningful results out of it you should either run it many more
times or redesign it to be less noisy.
Per test details#
For each test we have a more detailed plot showing median (blue bar), mean (crosshair), and standard deviation (black horizontal line) of the observed metrics:

Case study
This plot is from the same A/B test run that produced the confidence reports shown
before (the relevant bit is repeated right below for convenience). The runtime in the
two B setups (async_spill and async_spill_nohack) is solidly less than that in the
baseline and null hypothesis.

Case study
In this case, instead, you can clearly see that the noise-to-signal ratio is so high that there’s nothing useful to be gathered out of this test.
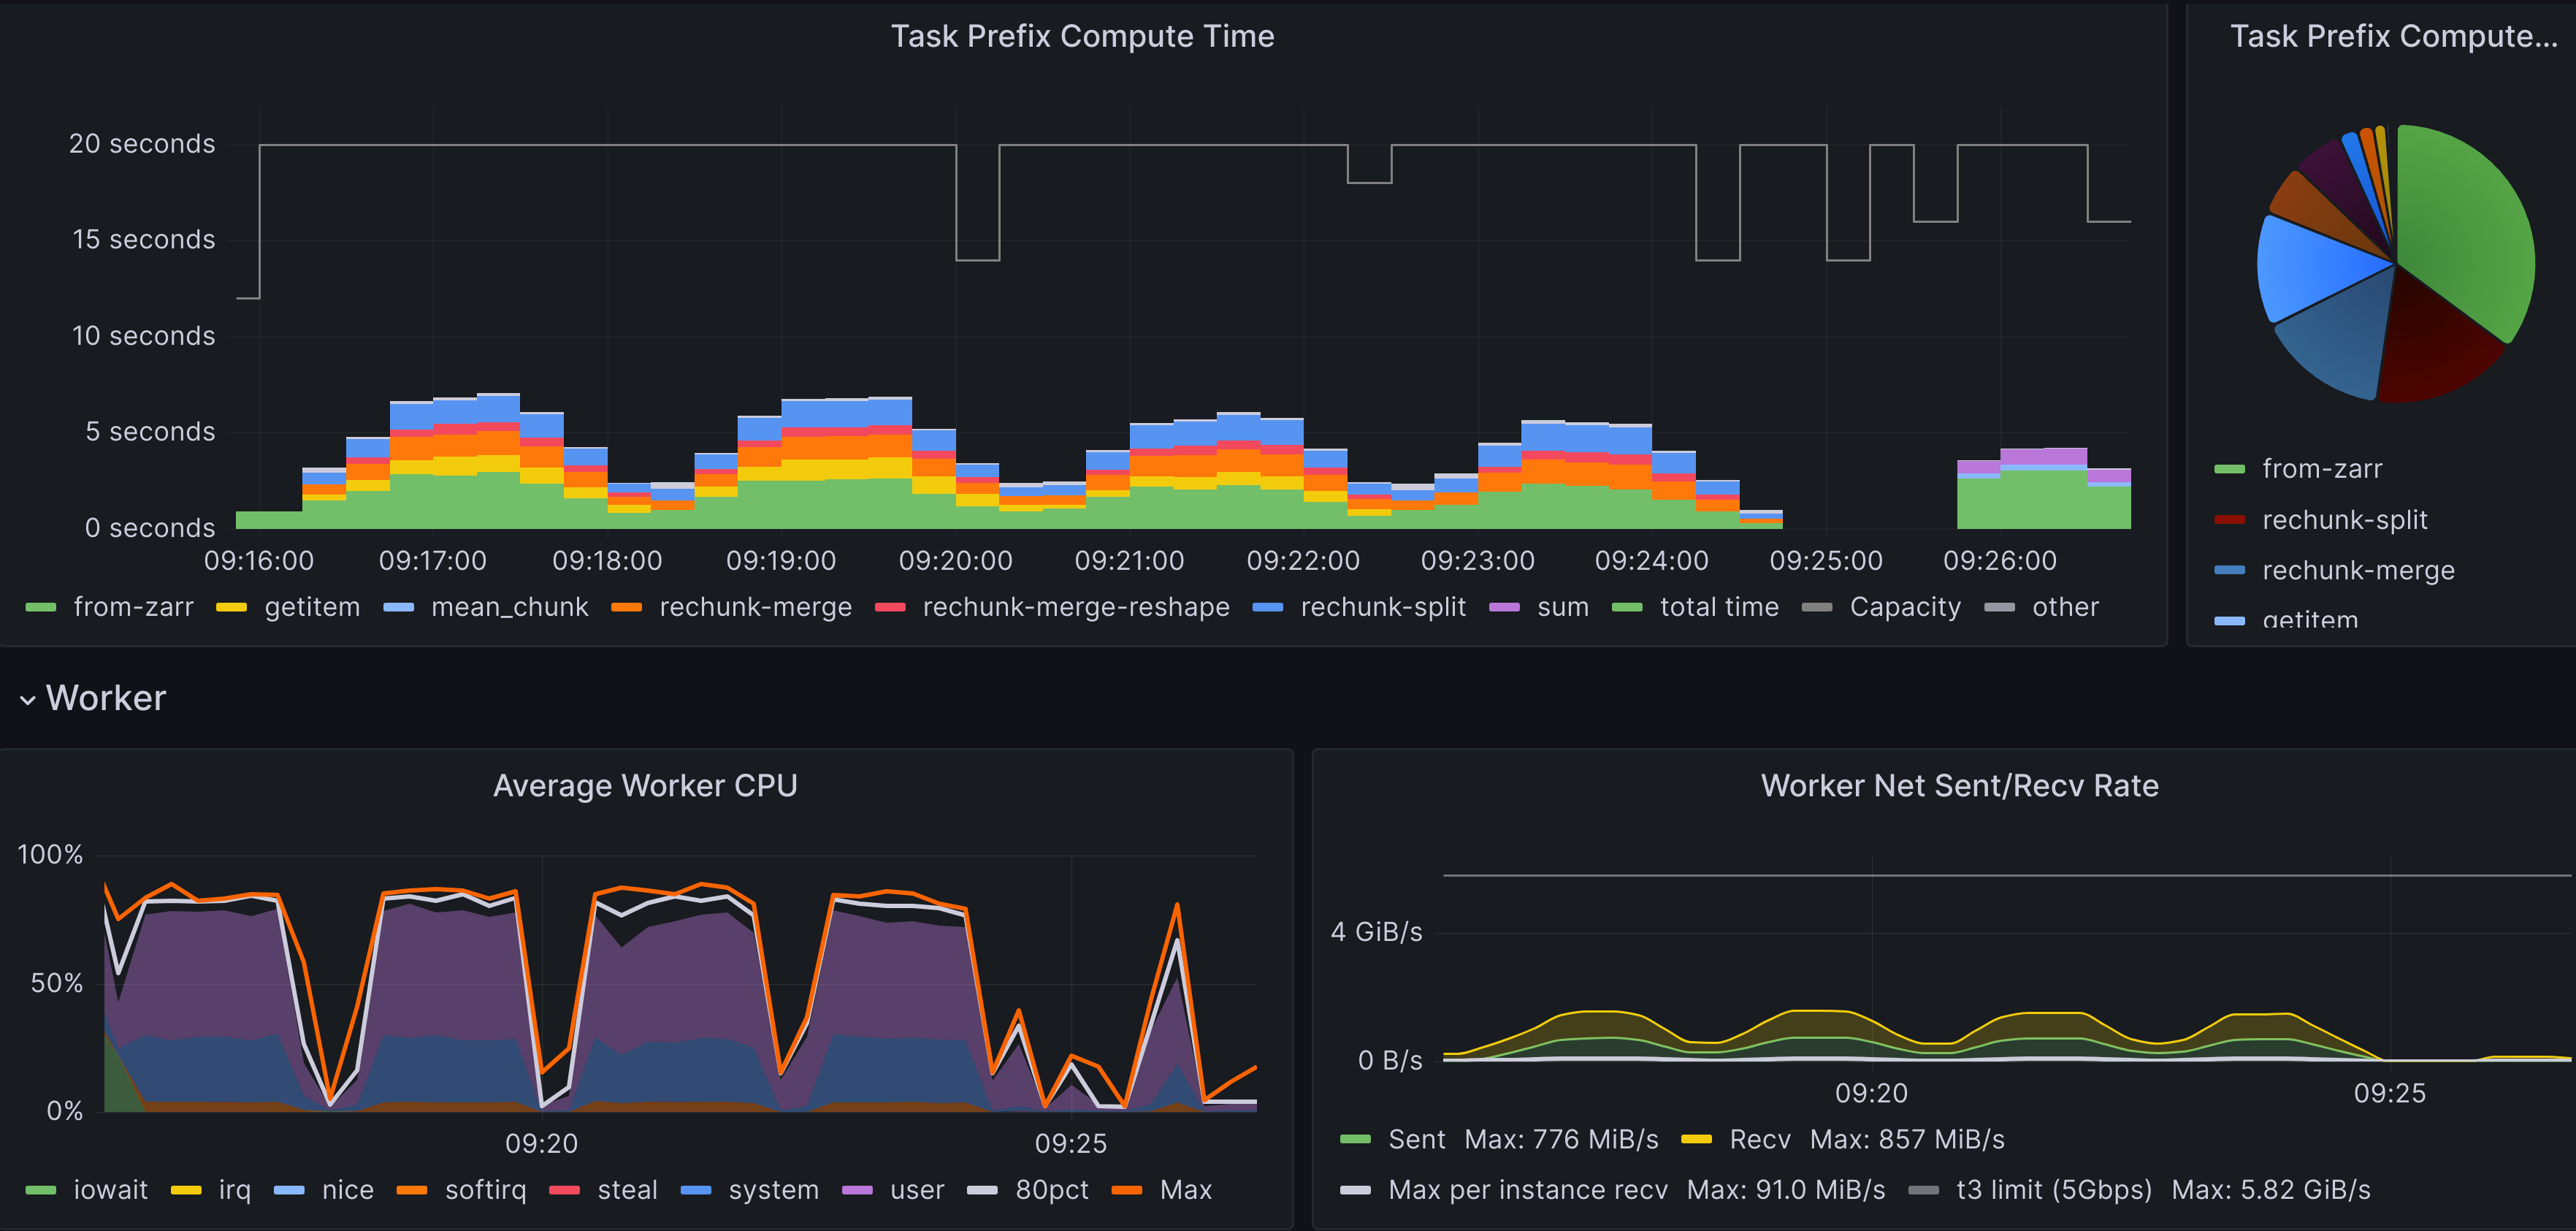
Introspection with Grafana#
Finally, from the aggregated statistical reports, using Prometheus and Grafana we can drill down into each individual run that underlies them and observe what happened during it. This gives us information such as the runtime of each task group, the breakdown of memory usage, network throughput, etc.
FAQ#
Q: Isn’t this very expensive?
A: Around $5 for the nightly tests and around $50 for a typical A/B test. The cost increases if you decide to increase the cluster size to hundreds of workers, but it’s not something needed every day.
Q: Could you simulate a slow network on localhost instead?
A: In theory, yes. In practice, we’d periodically need to make sure that the simulation behaves like the real thing. We’d also need to simulate actual task execution, as a single host would not be able to cope with the CPU and memory usage of a real cluster. We’d need to simulate how S3 behaves when multiple hosts request different files from it. There are many other pitfalls to consider.
Not saying that simulation is always a bad idea, just that it takes a substantial investment of time and effort to set up correctly and to ensure it keeps reflecting reality. Does each test run cost you $10 billion? Maybe you should figure out how to simulate it instead. Does it cost $50? Just not worth it.
What’s next?#
The current toolkit is extremely powerful and light years ahead of the previous condition of testing things by hand. However, there are still large margins for improvement:
Make it more user-friendly;
Make it more interactive. For example, if you see an increase in end-to-end runtime, you probably want to know where the extra time is spent. Dask is already producing this information; we’re working on properly storing, aggregating, and visualizing it;
Observe more metrics such as disk and network usage.
Finally, we’re exploring the possibility of opening this system to Coiled customers! For example, imagine if you could tag some of your runs as “A”, some others as “B”, and then ask the Coiled dashboard to show you statistical insights on the differences between the two sets. You would be able to test not only different versions of Dask and other dependencies, but also different versions of your own algorithm, different cluster configurations, etc.