Jan 16, 2024
3m read
One Billion Row Challenge (1BRC) in Python with Dask#
Sarah Johnson
Last week Gunnar Morling launched the One Billion Row Challenge and it’s been fun to follow along. Though the official challenge is limited to Java implementations, we were inspired by an unofficial Python submission and have our own unofficial submission for Dask.
Dask Results#
We ran the challenge on an M1 Mac (8-core CPU, 16 GB memory). Dask came in at 32.8 seconds (± 2.43 seconds, averaged across 7 trials). Here’s our implementation:
from dask.distributed import Client
import dask.dataframe as dd

client = Client()

df = dd.read_csv(
    "measurements.txt",
    sep=";",
    header=None,
    names=["station", "measure"],
    engine='pyarrow',
    dtype_backend='pyarrow'
)
df = df.groupby("station").agg(["min", "max", "mean"])
df.columns = df.columns.droplevel()
df = df.sort_values("station").compute()
Dask is a general purpose Python library for parallel and distributed computing. It’s especially nice for handling large datasets that don’t fit into memory on your laptop. For tabular data, the syntax is designed to feel very similar to pandas, so it’s nearly a drop-in replacement.
Where Dask does well, though, is when handling hundreds of GB of data distributed across many machines. We were actually pleasantly surprised to see this level of performance on a single machine for only a 13 GB dataset. This is largely due to a number of recent improvements in Dask like Arrow strings, new shuffling algorithms, and query optimization (see Dask DataFrame is Fast Now for more details on these engineering efforts).
How does Dask compare?#
Amongst the other 1BRC Python submissions, Dask is pretty squarely in the middle. It’s faster than using Python’s multiprocessing (except for the PyPy3 implementation) and slower than DuckDB and Polars. This is not too surprising given Polars and DuckDB tend to be faster than Dask on a smaller scale, especially on a single machine.

1BRC challenge performance for Python implementations of Polars, DuckDB, Dask, and Spark. Polars and DuckDB values are copied from this repo.#
We also ran the challenge for PySpark, which took ~2 minutes. We are by no means experts in this area though, and would welcome ideas for improvement. Here’s our implementation:
from pyspark.sql import SparkSession
from pyspark.sql.types import StructType, StructField, FloatType, StringType

spark = SparkSession.builder.master("local[*]").getOrCreate()
schema = StructType(
    [
        StructField("station", StringType(), True),
        StructField("measure", FloatType(), True),
    ]
)

df = spark.read.options(delimiter=";", header=False).csv(
    "repos/1brc/measurements.txt", schema=schema
)
df.createOrReplaceTempView("measurements")

query = """
SELECT station, MAX(measure) as max, MIN(measure) as min, AVG(measure) as mean
FROM measurements
GROUP BY station ORDER BY station;
"""

result = spark.sql(query).show()
TPC-H Benchmarks at Scale#
Digging a little deeper into Dask performance, we see most computation time is spent on I/O. Yes, this challenge is for fun! But a comparison predominantly based on which tool is faster at reading a CSV into memory does have its limitations. We thought we’d mention some other more meaningful performance comparisons.
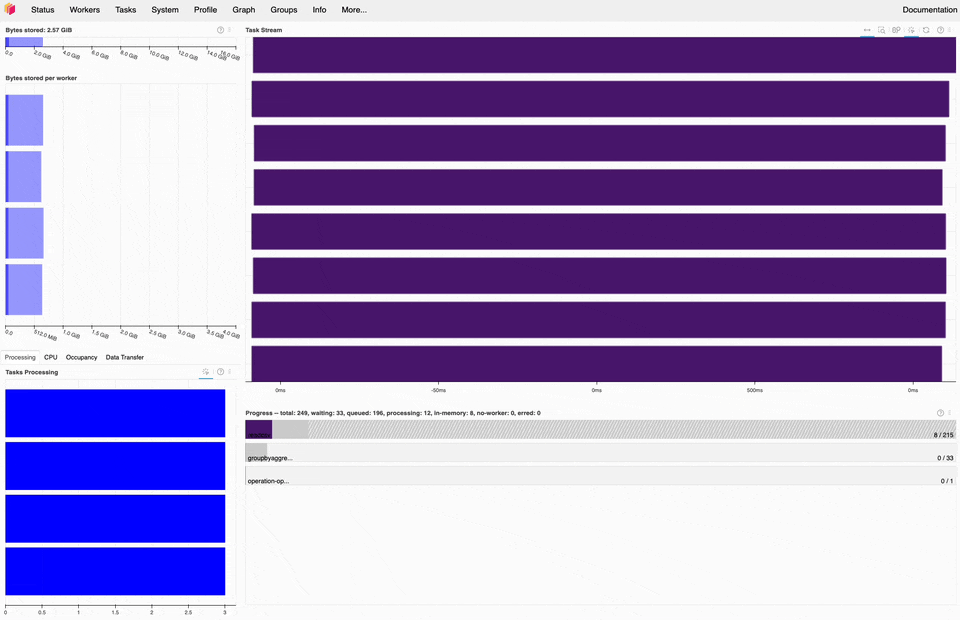
Dask dashboard during the 1BRC, most of the time is spent on read_csv tasks (purple).#
We’ve run a more robust series of TPC-H Benchmarks comparing Dask, Polars, Spark, and DuckDB ranging in scale from 10GB to 10TB. We ran these benchmarks on the cloud using Coiled, which makes it easy to run your Python code in the cloud. Coiled creates ephemeral VMs in cloud account that match your local environment and then cleans everything up when you’re done.
No project wins, and it’s interesting analyzing the results.
Run the challenge yourself#
First, you’ll need to generate the dataset. For those who are also less familiar with Java, the setup instructions in Robin Moffat’s post are quite helpful.
Next, you’ll need a Python environment with latest version of dask installed:
pip install dask-expr "dask[complete]"
Then you can run the challenge for Dask:
from dask.distributed import Client
import dask.dataframe as dd

client = Client()

df = dd.read_csv(
    "measurements.txt",
    sep=";",
    header=None,
    names=["station", "measure"],
    engine='pyarrow',
    dtype_backend='pyarrow'
)
df = df.groupby("station").agg(["min", "max", "mean"])
df.columns = df.columns.droplevel()
df = df.sort_values("station").compute()
You might also consider running the one trillion row challenge which scales up this dataset to one trillion rows, or ~ 2.5 TB.
Acknowledgments#
Thanks to both of the earlier Python submissions from Matthew Aylward and Italo Nesi. And, of course, to Gunnar Morling for holding the challenge in the first place.