Scaling Hyperparameter Optimization With XGBoost, Optuna, and Dask#
Scaling XGBoost and Optuna with Dask#
XGBoost is one of the most well-known libraries among data scientists, having become one of the top choices among Kaggle competitors. It is performant in a wide of array of supervised machine learning problems, implements scalable training through the rabit library, and integrates with many big data processing tools, including Dask.
While XGBoost enables distributed model training, hyperparameter optimization (HPO) adds a layer of complexity which only grows with the size of the dataset. Tools like Optuna have emerged to reduce this friction by dynamically optimizing the HPO search space providing much-needed visibility into this process, and enabling parallel HPO, but in this paradigm, the distributed HPO step remains disconnected from data engineering. Examples of recent integrations between Dask and Optuna show how bringing distributed feature engineering together with HPO simplifies the workflow for machine learning engineering workflows.
Here, we demonstrate one way to connect these pieces of the data science workflow on a dataset with hundreds of millions of rows. This is accomplished by leveraging Dask for exploration and feature engineering. Distributed hyperparameter optimization and distributed model training are enabled through native dask integration with Optuna and XGBoost, respectively. We bring all of these tools together by spinning up dask clusters on-demand with Coiled. Code for this work is located at this GitHub repository.
The Problem To Solve#
For this example, we extend on our work demonstrating the use of Coiled and Prefect to automate data engineering workloads, by leveraging the initially prepared New York City “For Hire Vehicle” taxi dataset as a source for exploratory analysis. Cleaning the data consists of declaring datatypes and partitioning files to manageable partition sizes.
One motivating problem with the New York City Taxi dataset is to predict expected trip duration. This has been the topic of both Kaggle competitions and the subject of research papers. We will use this as a motivating example, as it allows us to explore many steps in the data science workflow. Much of this previous work was based on the New York City Taxi data. In our example, we will focus on the New York City For Hire Vehicle dataset (e.g. Uber/Lyft).
Given this, our goal is to train an XGBoost model to predict trip duration (in seconds), given a projected route, projected pickup time and known pickup/dropoff locations as well as current traffic conditions. Given those variables, we expect variables like tolls, congestion_surcharge and airport_fee are available, whereas sales_tax and tips can only be known after the trip has been completed. We will also take inspiration from the geospatial research paper above, by engineering categorical features based on the concept of Superboroughs, which are derived from domain knowledge about trips that require bridge crossings.
Getting Started#
Since it’s faster to perform exploratory analysis with data that fits in memory, we start by creating a distributed compute environment and select a representative subset of the data. Using Coiled, we spin up a Dask cluster, and after some exploration, sample 2.5% of the data (or 1.6MM rows), and write this to a single local Parquet file for ease of use.
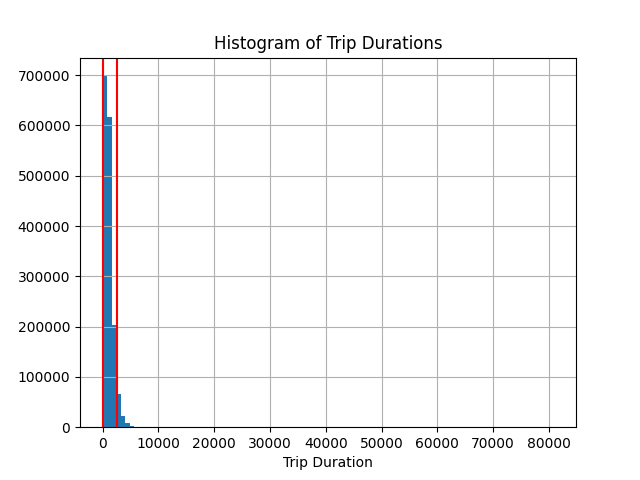
Exploratory analysis with Pandas shows our travel time is (unsurprisingly) not normally distributed, and almost certainly contains outliers. We remove outliers using the IQR Method. Given the knowledge no trip should have a duration with a negative value, we floor the lower bound at 0 seconds. Boundaries are shown on the histogram plot, and filtering results in a removal of 4.6% of the data.
Building on our research paper’s definition of a Superborough with the taxi+_zone_lookup dataset, we map each Pickup and Dropoff LocationID to a Borough, and subsequently to a Superborough, deriving a categorical feature CrossSuperborough that defines whether a trip requires crossing between Superboroughs.
We drop columns containing data that is expected to be unavailable at the time of prediction and clean up features related to route planning, with the result being a mixture of float, int, and categorical variables.
Finally, for the in-memory example, we prepare three models using the following estimators: DummyRegressor(), LinearRegression(), and XGBRegressor(), and compare their performance when evaluating against a test dataset using rmse metric. Results are summarized below, recalling that our travel durations are expressed in seconds:
Estimator |
RMSE |
|---|---|
DummyRegressor() |
556.7 |
LinearRegression() |
324.4 |
XGBRegressor() |
236.2 |
These results, while sligthly better than those reported in the research article, mirror the trend reported by the authors.
Scaling XGBoost and Optuna with Dask#
One of the enabling attributes about working in Dask is the tight integration between the pandas and Dask. Scaling our pandas feature engineering to the entire dataset with Dask is more natural than if we were to rewrite it to a different language, which accelerates the process of scaling our workload from a subset of the data to the entire dataset. Executing on this vision is accomplished by breaking our feature engineering and model training steps into two discrete pipelines, as shown in feature engineering and model training notebooks.
Our feature engineering occurs in two steps. The first loads our minimally cleaned dataset into a Dask cluster, creates a handful of columns that will ultimately become categorical variables, drops unneeded columns, and removes outliers. Our second function merges the data with the taxi+_zone_lookup data to create the Superborough categorical feature.
A few observations about scaling this work to the entire dataset:
There’s active work underway to fully implement pandas Nullable datatypes, but at the time of this writing, using these datatypes across
pandas,Dask,Parquet DatasetsandXGBoostis not recommended.The default method for calculating
percentileswith dask is known to give potentially incorrect results. For more information, see here, here, and here. This manifests in our outlier detection method, such that <0.25% of the data is discarded when performing thepercentilecalculation with dask on the entire dataset, as opposed to the 4.6% discarded our sample. The suggested solution is to use thetdigestmethod, which requires crick, which itself is currently being updated for compatibility with recent version of python and scipy. We attempt to mitigate this by using the 75th percentile calculated by pandas (under the assumption that our randomly sampled dataset is representative of the entire dataset), but this approach only discards 1.6% of the data, suggesting our assumption is incorrect.Filtering a Dask DataFrame can lead to empty, or sparsely populated partitions. See the following for best practices around repartitioning DataFrames for optimal performance.
Tuning the XGBoost Model#
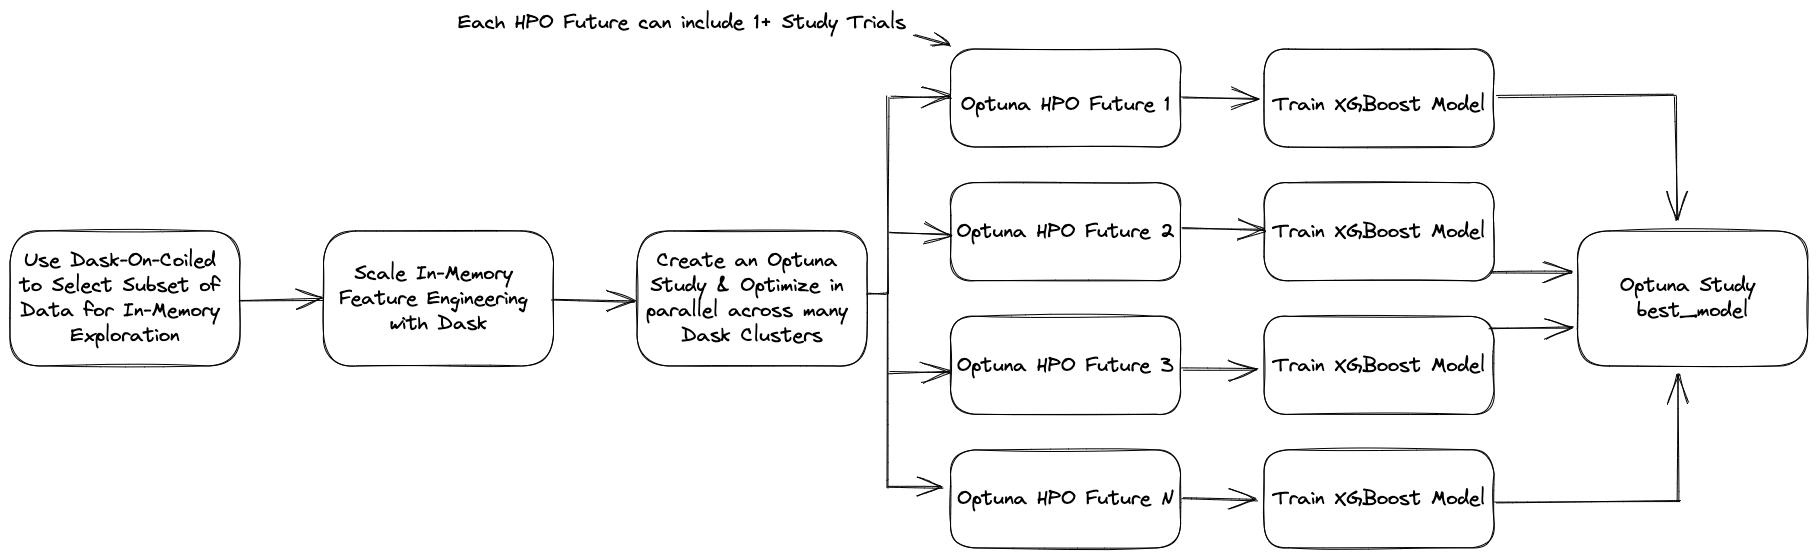
Recent work by Dask and Optuna developers enabled native Dask integration with Optuna. This work, combined with the enabling of study.optimize in multiple threads allows parallel hyperparameter optimizaton by creating a Python function that will:
Create a remote dask cluster
Load the
feature_tablefrom a Parquet DatasetTrain an XGBoost model using cross-validation
Executing this function in a thread allows running many dask clients locally, with each client connecting to a separate remote dask cluster. Optuna enables hyperparameter optimization across these dask clusters by independently training xgboost models.
A few notes and observations about performance:
Using categorical dtypes requires that the categories are
known. Writing a DataFrame with categorical datatypes to a Parquet Dataset causesknown categoriesto be lost.scikit-learn implements cross-validation by generating indices for splitting a dataset into
trainandtestsets, but positional indexing into a Dask DataFrame is inefficient. Here, we tackle this by making use ofDataFrame.random_split().Creating a DMatrix forces lazy computation to evaluated, so we need to be mindful of when and how these are created.
We use the
dask-mlimplementation ofmean_squared_errorto keep this computation on the cluster.We periodically observe
concurrent.futures._base.CancelledErrorwhen performing ourcv_split. This seems to be connected to dask/distributed #4612. We can avoid this by adding an explicitwaitwhen calculating thermse scorefrom each training iteration.
Why Does The Dask Cluster Seem Idle When Training A XGBoost Model?#
When training XGBoost models on a dask cluster, parallelization of the training step is handed off to rabit, which uses all available threads on each dask worker. From the user’s perspective, the dask dashboard may seem idle during this phase of the workflow, but watching the CPU Utilization tab will give visibility to the training step, even though the dask task stream is empty. By default, xgboost uses all available threads on each worker for training. Here, we train on a dask cluster with 10 workers, and compare the performance of multiple EC2 Instance Types, with the following execution time / behavior. Later in the post, we will explore this further.
EC2 Instance Type |
# Cores |
Memory (GiB) |
Training time / iteration |
|---|---|---|---|
m6i.xlarge |
4 |
16 |
Training doesn’t start after 5 minutes, killed |
m6i.2xlarge |
8 |
32 |
Training succeeds, 90–180-seconds – some trials fail with |
m6i.4xlarge |
16 |
64 |
Training succeeds, 90–180-seconds |
Model Training Outcomes#
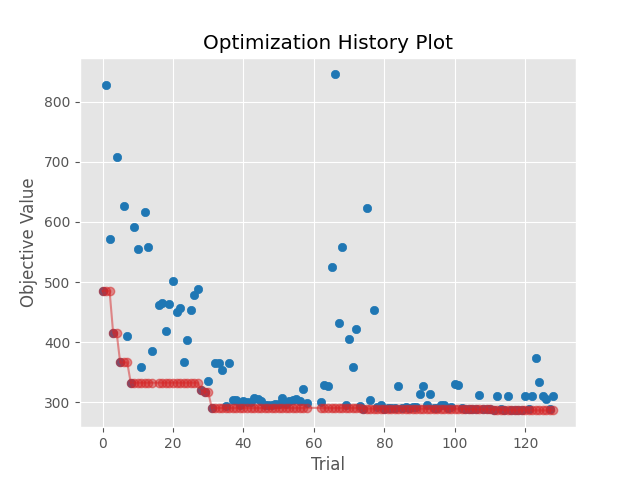
Below, we can see the outcome of our hyperparameter optimization experiment. This shows the progression of the rmse during the optimization process. We trained 129 separate models using 5-Fold Cross-Validation, with the best model having a rmse=286.4 seconds.
We can also inspect the impact of different hyperparameters on the overall model performance, as shown in the Hyperparameter Importances plot below.
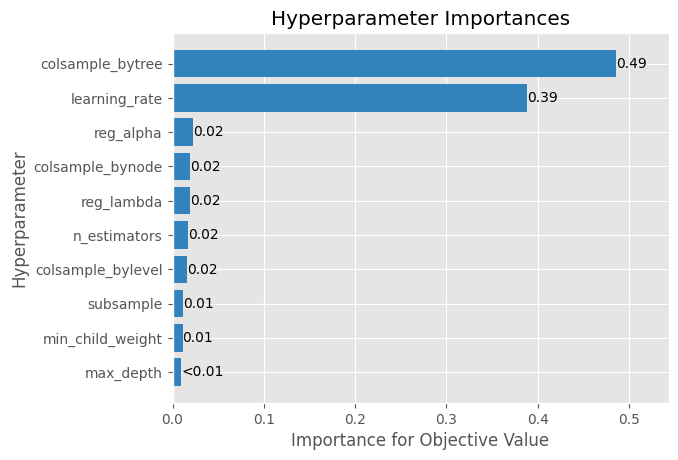
At this point, we have the option of training a model using the best_params from our Optuna Study to save for deplopyment, or optionally, doing additional experimentation based on the most current set of results.
Diving Deeper Into Training XGBoost on Dask#
In the above look at the impact of Dask workers based on different EC2 Instance types on model training, we observed dramatically different performance during the XGBoost model training phase of our workflow. We can leverage recent work with Grafana by the team at Coiled to delve into these differences.
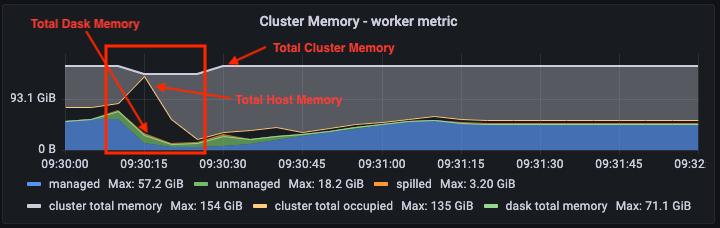
The above Grafana plot show cluster-wide memory-usage during the dispatch train step for ourour workflow. The white line is total memory usage, the green line is total dask memory usage, and the yellow line is total_occupied_memory. Normally, we expect dask’s view of memory and the host’s view of memory to be very close. Recall however, that training the XGBoost model is dispatched to the rabit library.
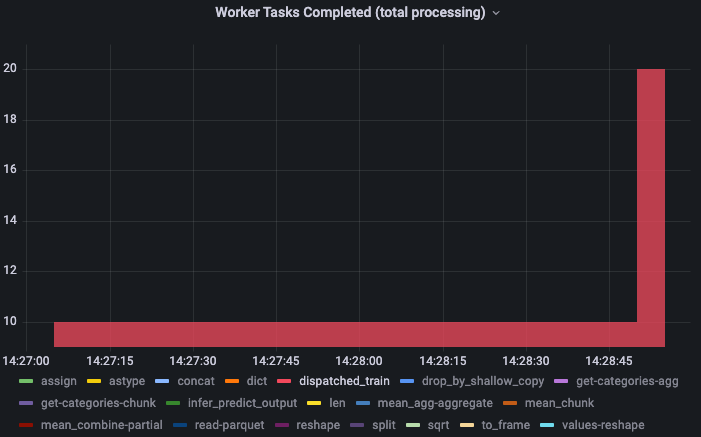
At about the 09:30:10 mark, the Grafana dashboard shows memory pressure falling, which is consistent with what is reported on the dask dashboard. But host memory pressure spikes at 09:30:15. This happens when model training is dispatched to rabit. Dask has no visibility to this process, so everything looks fine on the dask dashboard, but Grafana sees this on the host. In fact, the memory pressure was so high that at least one EC2 instance was unable to report metrics for about 20 seconds, as evidenced by the apparent dip in total_cluster_memory. We also see that, during this 17-second time window, no tasks are completed.
By comparison, the following plots show the same views during the dispatch step, when run on a cluster provisioned with m6i.4xlarge workers.
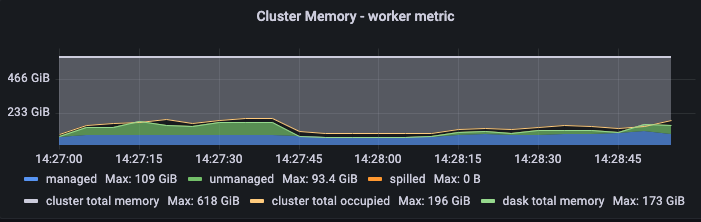
Notice the much smaller gap between the host’s view of memory usage and dask’s view of memory usage on the cluster.
To extend on this further, the following plot shows total memory usage during an AllReduce error event. Observe the gap between the host’s view of memory and dask’s view.
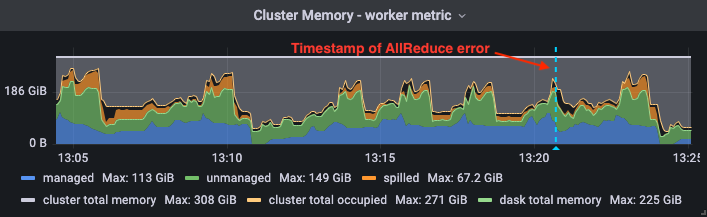
While we have no idea how this will (or will not) manifest when deploying Dask to different deployment environments, it’s a potential pitfall when training XGBoost models with Dask. It also presents a potential opportunity for enhancements in future work.