May 15, 2023
2m read
GIL monitoring in Dask#
Miles Granger
Added in version 2023.4.1: Support GIL contention monitoring.
With release 2023.4.1,
dask.distributed adds support for monitoring Python’s
Global Interpreter Lock (GIL).
New GIL “Contention” monitoring dashboard at <<dashboard host>>/individual-contention
Why should I care?#
Well, if you are running a single-threaded Python application, odds are you don’t need to care much. In the context of Dask though, it can potentially make a significant difference in performance.
Code running on Dask runs in a threaded environment with other threads doing compression, disk I/O, network I/O, and other user code. Hopefully this code uses the GIL in a judicious manner.
GIL monitoring through the dashboard and Prometheus metrics enables users to identify workflows that can be improved to be more GIL friendly.
Alright fancy pants, how do I activate this feature?#
Just have gilknocker installed. 🚀
By default the dask.config
has distributed.admin.system-monitor.gil.enabled=True.
Tip
It’s likely this will cover your needs, however one can additionally adjust
distributed.admin.system-monitor.gil.interval. At the time of this writing, it
defaults to 1 ms but can be changed to be a higher or lower frequency. This will affect
the frequency in which the GIL is polled to determine how busy it is.
Example
Here is an example adjusting the frequency for GIL polling to 10us.
distributed:
  admin:
    system-monitor:
      gil:
        enabled: true
        interval: 10us
Is there a performance impact by enabling this feature?#
It depends. 😉
With that said, it’s quite likely you’ll experience no noticeable impact on performance using the default settings. Should you increase the polling interval to a higher frequency, then this will contribute to more GIL contention and potentially lead to decreased performance.
Let’s look at a comparison we ran before adding this feature, with GIL monitoring enabled (left) and disabled (right).
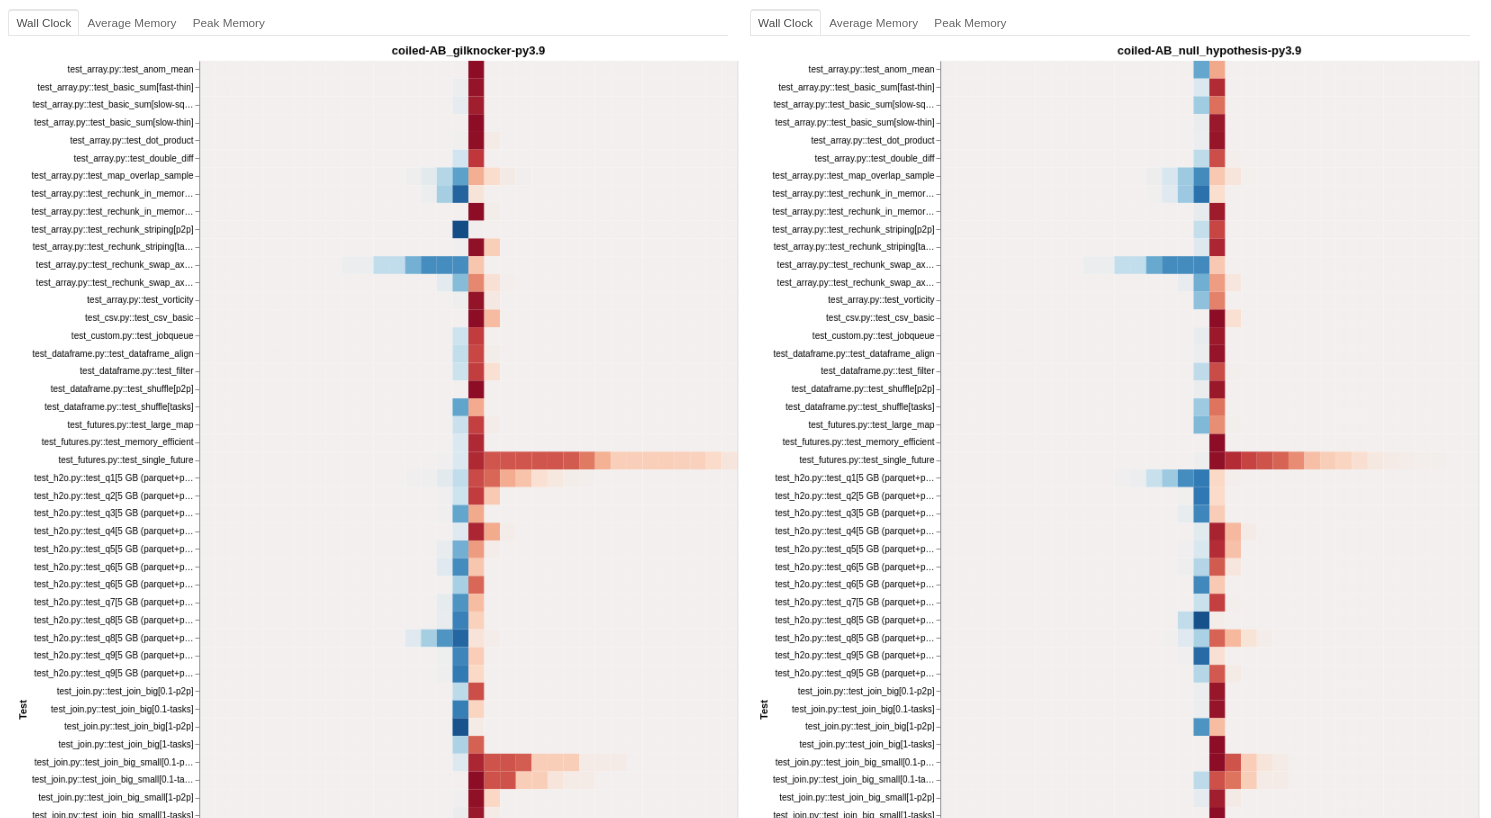
What am I looking at?
In an effort to preserve stable performance, we use Coiled’s A/B benchmarks to show the negligible performance impact of GIL monitoring.
Above we have a comparison of confidence intervals against the null-hypothesis, that is to say, not monitoring the GIL.
Each row represents a single benchmark test, the blue meaning improvement and red a regression. There is always variance to some extent, represented by the spread horizontally and shading. However, the more similar the two charts look, the less likely there is a performance difference.
Summary#
With GIL monitoring you’ll be able to view how your code behaves in this context and enable you to make more informed decisions on performance improvements.
To enable monitoring the GIL, you only need to install gilknocker which is available
on conda-forge and
PyPI.
While these metrics are available with
Prometheus,
you’ll also get an updated dashboard called “Contention” located at
<<dashboard host>>/individual-contention displaying the Event Loop and GIL
contention metrics in realtime.