
Coiled Stability Update#
Coiled experienced two outages in the last few weeks; several production resources began operating too close to their limits, and our monitoring did not surface the risk early enough. The result was multiple production outages. This level of stability does not meet Coiled’s standard for a service customers rely on, so we want to share what happened and what we have done to address it.
Database CPU Saturation#
On May 6, the production database became the bottleneck when the Aurora writer sustained near-max CPU utilization. During that period, database-backed platform operations became slow or unreliable, including cluster startup. Each cluster startup includes a check of current account usage and quota to ensure users don’t go past their desired spend limit. That check performed a CPU-intensive scan to sum historical usage, and as startup volume increased, both the number of checks and the amount of historical usage data grew. Together, that put too much load on the database writer.
This has been fixed by moving usage calculations to incremental running totals. Instead of scanning historical usage on every cluster startup, quota checks now use a stored checkpoint and only process newer usage events.
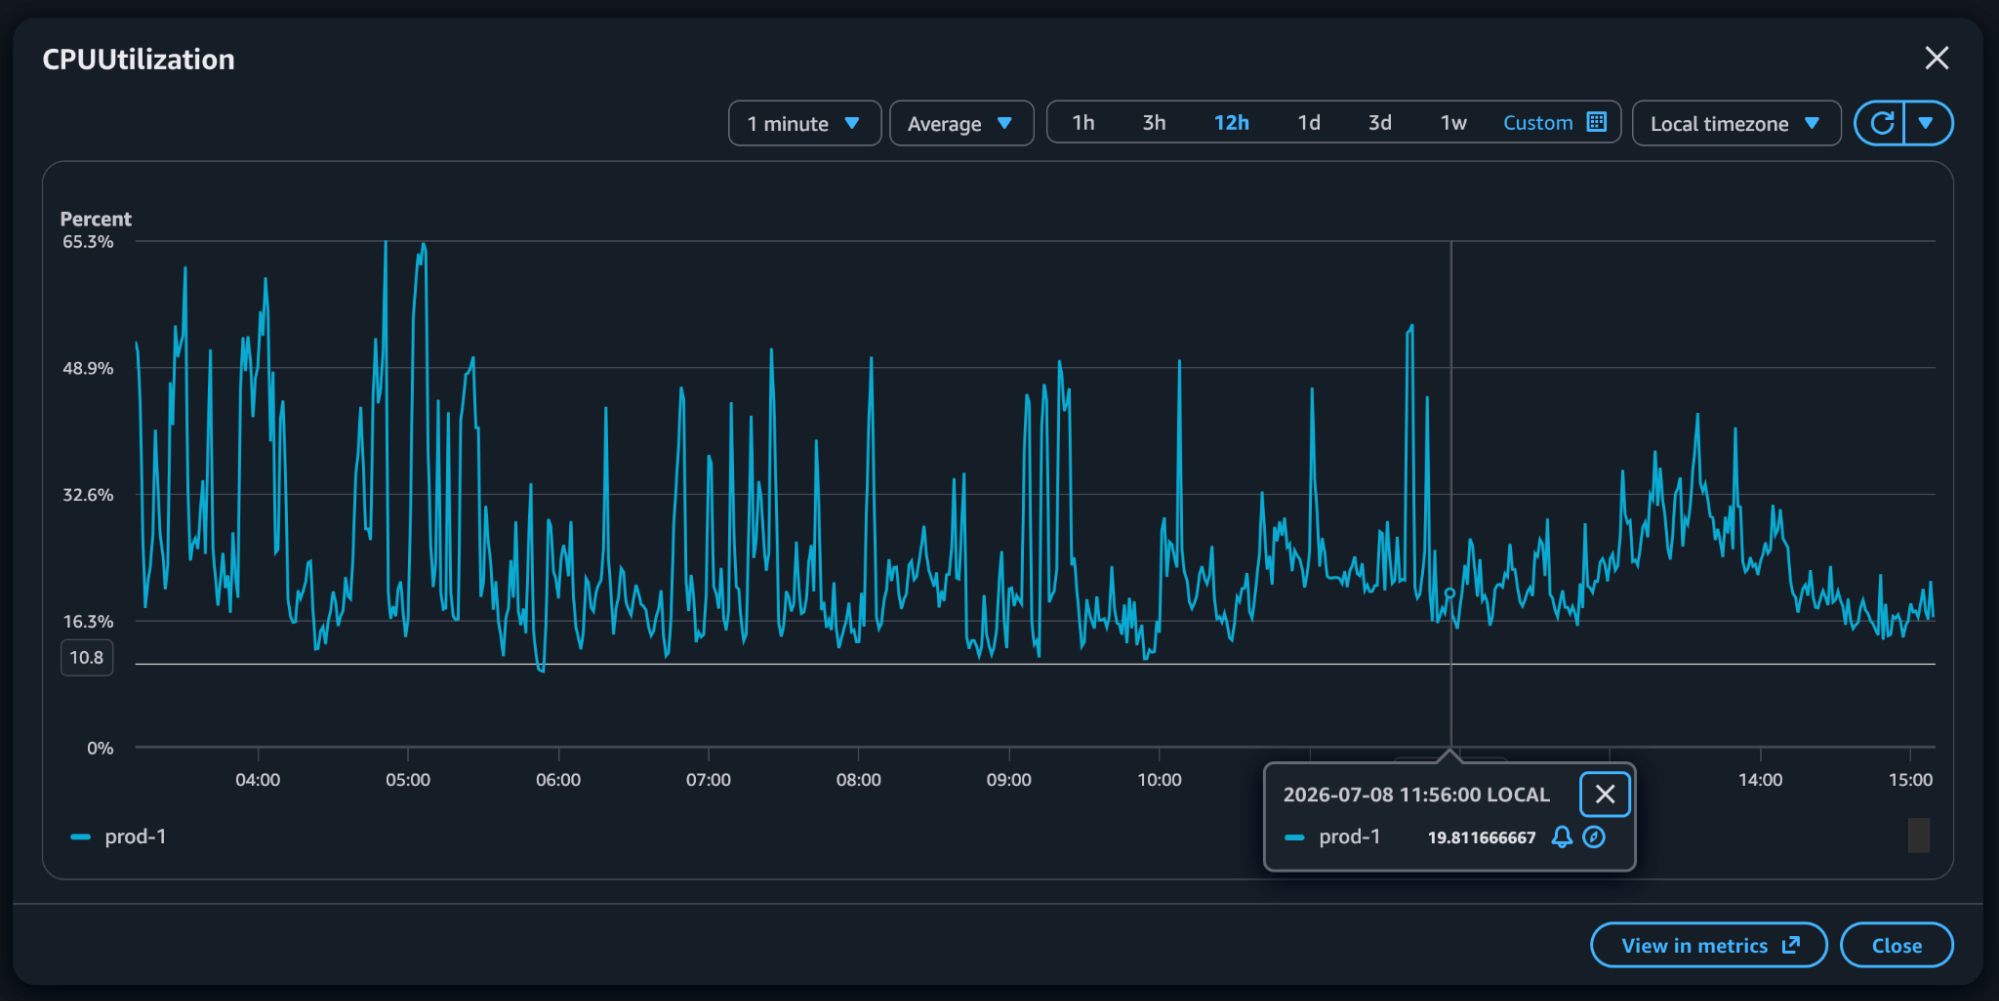
RDS CPUUtilization panel in the AWS console.#
The impact is visible in RDS CPU utilization for the production Aurora writer. Before the deployment on July 8, CPU was highly variable with frequent spikes; the deployment occurred after noon, and utilization was lower and more stable afterward. Improved database monitoring and alerting is also now in place so database pressure is visible earlier.
Application Memory Saturation#
On June 29, the application infrastructure serving platform traffic became non-responsive due to memory saturation, causing platform requests to fail. Increased platform traffic had driven memory utilization higher across the app stack, pushing the service too close to its operating limits.
This has been addressed with the following interventions:
increasing application serving capacity and memory headroom
rolling application logs more aggressively after disk pressure was found to be contributing to instability
tuning app worker counts
removing unnecessary application dependencies
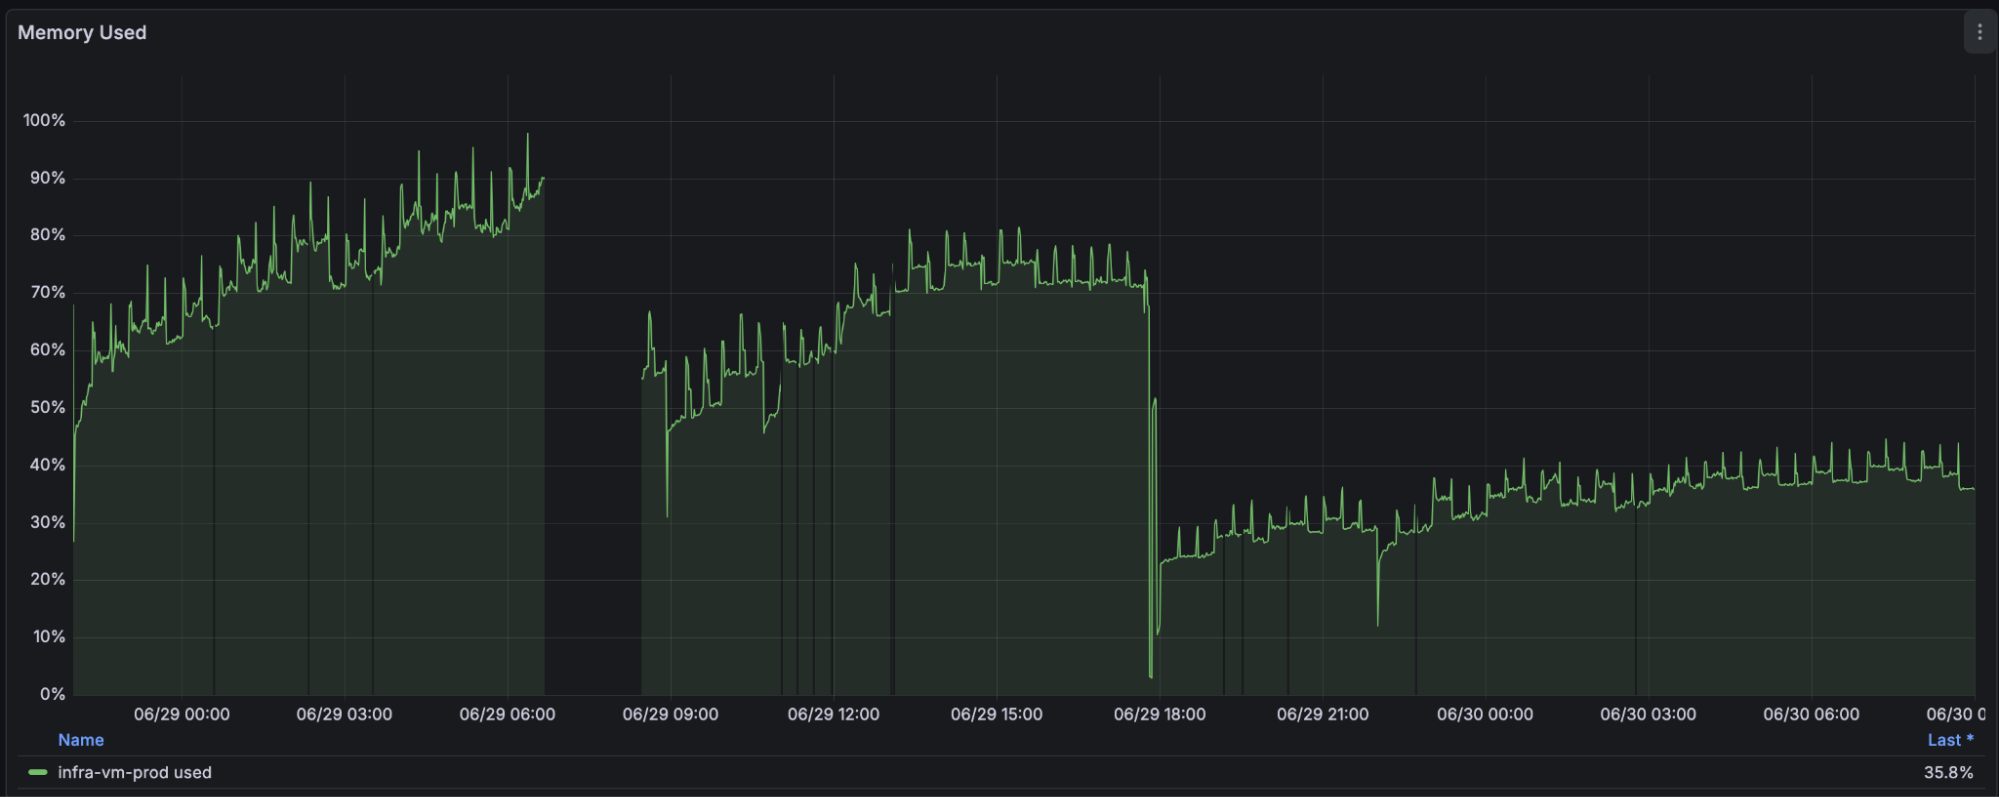
Application memory utilization in Grafana.#
Grafana metrics show the impact of the resize: before the incident, application memory utilization was steadily climbing and reached roughly 90%, leaving little operating headroom. After application serving capacity was increased later on June 29, memory utilization dropped sharply and stabilized around 25-40%, leaving substantially more room for traffic spikes.
This incident also exposed a monitoring gap. During our move from Datadog to Grafana, host-level resource alerts had not been fully re-established, so memory and disk pressure were not surfaced early enough to operating engineers. Alerting on host saturation is essential for a service like Coiled, and host-level Grafana monitoring and alerting is now in place for metrics like memory and disk utilization.
Silver Lining#
These failures were due to load increasing beyond our expectations and plans. Usage has roughly doubled since the beginning of the year. While this doesn’t excuse outages, it does signal that the company itself is healthy and highly motivated to keep the platform well supported and running smoothly. This is our top priority.
Closing#
The main lesson is that saturation becomes a production risk before a resource reaches 100%. We have added capacity, reduced avoidable database load, and put monitoring in place so these pressures are visible earlier.
We know Coiled is a service that customers depend on to run important workloads. Supporting those workloads reliably is our highest priority, and we will continue to invest in the capacity, monitoring, and operational practices needed to meet that bar.